
Announcement: Grepsr has been ranked as the #1 web scraping service provider by Tech Times!


Search here
Can't find what you are looking for?
Feel free to get in touch with us for more information about our products and services.
 Use Cases
Beyond the Data: Consulting for Smarter, POI-Driven Business Decisions
Planning a business expansion is similar to plotting a journey on a map. Just a destination is not enough – you need the right routes and key landmarks along the way.
In the same way, identifying the ideal locations for growth starts with the right data, but raw data alone is like a map with no directions.
This is where POI (Point-of-Interest) data extraction becomes your compass. By mapping the key landmarks like schools, retail stores, residential areas, and high-footfall locations, businesses can pinpoint the most promising areas for expansion.
But the adventure doesn’t end there. Just as a map provides only a broad view of the landscape, POI data without insight is just a collection of points, not a clear path forward.
To navigate it successfully, businesses need to analyze, interpret, and strategize. What makes this process easier is visualizing the POI data on interactive maps.
In one such case, we went beyond just providing POI data, we became the strategic guides for a leading FMCG client looking to expand its ice cream brand into a new market.
Now, let’s dive into this specific use case and explore how we evolved from a data provider to a trusted business consultant.
About the client and their requirement
The client, a global leader in the FMCG industry, is renowned for its wide range of products, including popular food brands. As part of their strategic growth plan, the company sought to expand its new product – ice cream – into a new, highly competitive market.
The challenge? Identifying the right locations for expansion that would guarantee foot traffic, high demand, and ultimately, success.
To achieve this, the client needed more than just data – they needed insight. The aim was to locate areas that aligned with their target customer base, areas with high potential for sales and brand visibility.
They required a solution that would go beyond basic demographic data and offer a clear, actionable path forward, helping them make smart decisions on where to introduce their products.
Key requirements included:
- Location Prioritization: Identifying regions with high foot traffic and potential customer demand. Areas that weren’t just populated but reflected the right consumer behaviors for their brand.
- POI Mapping: With a focus on key Points-of-Interest (POIs), such as retail stores, schools, and shopping complexes, the client wanted a comprehensive map that could guide decisions based on location clustering and accessibility.
- Strategic Market Expansion: They needed a consulting approach that would translate this data into actionable insights, guiding them to the most profitable regions for expansion and investment risk management.
In essence, they were looking for a trusted partner who could deliver data and also a clear, data-driven strategy for their market entry.
The challenge
For the global FMCG company, the challenge was twofold: identifying the right locations for new ice cream outlets and ensuring those locations could support the unique needs of the product, including refrigeration.
In this case, the product was ice cream – a perishable treat that requires proper refrigeration to maintain its quality and appeal. The client’s goal was to expand their ice cream distribution into underserved areas, but simply opening new outlets wasn’t enough.
The right locations had to be selected to ensure not only high foot traffic but also the ability to store and sell the product effectively.
The client’s expansion needed to be data-driven and strategic as the market is fierce with competition and high consumer expectations.
So to address these challenges, they needed:
- In-depth insights into consumer behavior to understand where potential customers lived, worked, and shopped: areas with the most foot traffic and interest in ice cream.
- Data-backed demand forecasting, identifying locations with the highest potential for sales, based on key factors like population density, existing POIs, and seasonal foot traffic patterns.
- A scalable, replicable approach to expansion that highlighted the best locations for high sales potential, and also ensured these areas could support the necessary refrigeration infrastructure to sell the product.
The solution had to combine geospatial data, POI insights, and a thorough understanding of local consumer behaviors to navigate the market and identify the best locations for opening new outlets.
The solution
To solve this challenge, we built a location potential scoring system designed specifically for ice-cream expansion.
We translated multiple real-world factors into a clear, unified scoring framework. This ensured that every recommended location was backed by measurable evidence, not guesswork.
The solution centered around three core pillars:
Population Influence Score
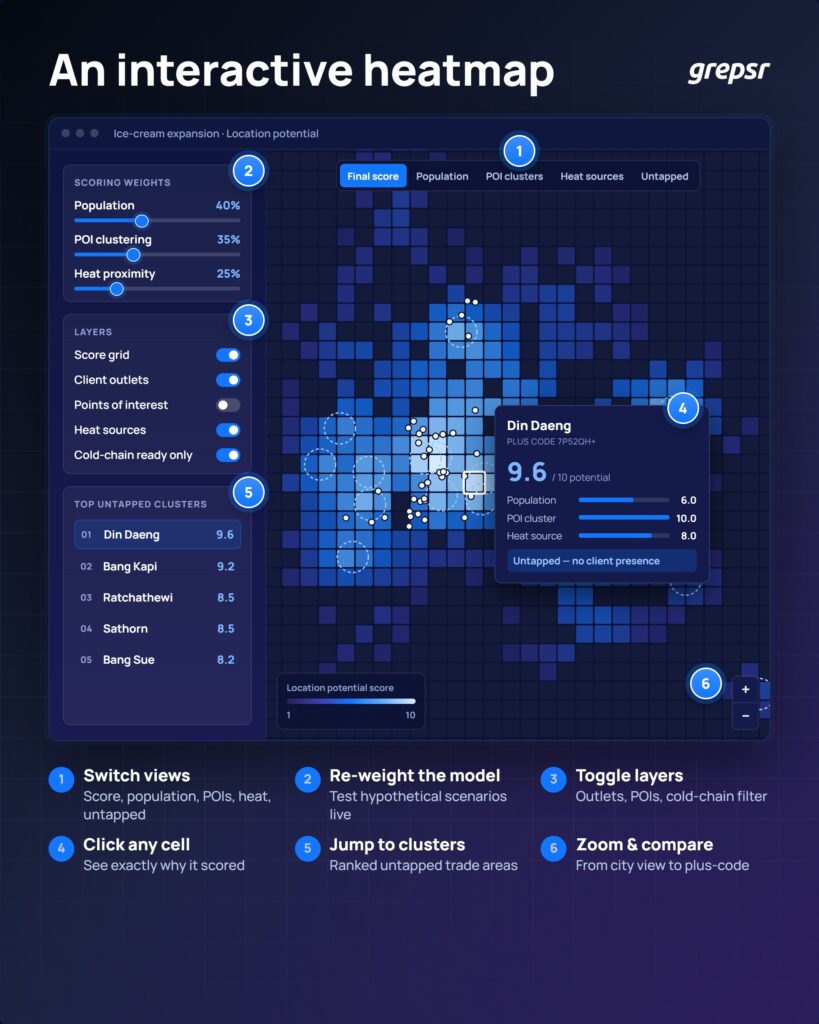
We mapped population clusters to understand where people live and move. High-density residential areas naturally correlate with higher demand for everyday treats like ice cream. This score quantified the demand potential at a granular, plus-code level.
POI Clustering Score
Ice cream thrives where people are already on the move. We analyzed surrounding POIs like schools, convenience stores, apartments, pharmacies, local markets, and retailers to identify everyday footfall corridors. Locations surrounded by relevant POIs received higher scores because they reflect consistent consumer activity.
Heat-Source Proximity Score
Tourist areas, beaches, parks, leisure zones, promenades, and shopping hubs sustain high impulsive buying behavior, especially for cold products. We measured how close each plus-code was to these “heat sources” and incorporated those demand signals into the scoring.
Together, these three components formed a holistic numeric score from 1 to 10, revealing which micro-locations were most primed for ice-cream expansion.
But the solution didn’t stop at generating scores. We delivered everything through an interactive geospatial map, allowing the client to visually explore population pockets, POI clusters, scoring density, and expansion opportunities — all in one place.
The approach
Our approach blended data science, geospatial intelligence, and business consulting into a single, end-to-end strategy. We moved beyond being a data provider and stepped into the role of a consulting partner, guiding the client’s expansion roadmap.
Here’s how we approached the project:
Understand the business context
Before extracting POI data, we first aligned with the client’s business goals, product requirements, and operational constraints. Mainly, refrigeration availability and sales feasibility. We tailored the scoring model to these real-world conditions.
Gather and clean relevant data
We sourced nationwide POIs, population distribution datasets, administrative boundaries, and heat-source categories. After cleaning the data, we aligned everything to plus-code granularity, ensuring consistency across the country.
Design a transparent scoring framework
Each score component was explainable, configurable, and directly tied to business outcomes. This allowed stakeholders to understand why a location was recommended — making the model both trustworthy and adaptable.
Map-based visualization for decision making
Rather than handing off spreadsheets, we deployed an interactive map with layers for population density, POI clusters, heat sources, and final scores. This made insights intuitive, allowing the client to zoom into neighborhoods, compare micro-regions, and shortlist locations with confidence.
The impact on business
Thanks to the strategic insights derived from POI data, population density, and proximity to key heat sources, the global FMCG company is now well on its way to successful market penetration and sustained growth.
Through our actionable recommendations, they are:
- Targeting high-demand locations: They are directing their efforts toward regions that not only show the most promise but also offer the infrastructure required to store and sell ice cream effectively, ensuring long-term profitability.
- Allocating resources efficiently: With our data-backed approach, the client is confidently investing in regions that offer the best opportunity for success, minimizing risk and maximizing their chances of a high return on investment.
- Expanding with confidence: The interactive maps and scoring tools have become an integral part of their strategy, empowering them to make informed decisions about future locations while maintaining a scalable model for growth.
In short, Grepsr’s consulting service has provided the client with a clear, actionable path for expansion.
Take your business to the next level with Grepsr’s Data-Driven Consulting
At Grepsr, we don’t just deliver data, we help you turn it into actionable insights that drive real growth. Our expertise in combining high-quality data with strategic business consulting enables you to make smarter decisions, scale faster, and reach your goals with confidence.
So, whether you’re expanding into new markets or refining your strategy, we’re here to guide you every step of the way with data solutions that grow with your business.
Contact us today to turn raw data into your business’s competitive edge!

Shaping a prosperous future with data-driven decisions
Before It Trends: Social Listening at Scale for a Global FMCG Brand
Most brands don’t know what to monitor when they come to you. There’s no keyword list waiting to be handed over, no tidy set of hashtags someone already tracks. That decision hasn’t been made yet, and it turns out to be most of the work. Meanwhile, the thing worth tracking is already moving. New words […]
From Product Catalogue to AI Citation: AI Prompt Monitoring for Brand Visibility at Scale
Each passing day, we users skip traditional search engines like Google and Bing for our queries. We directly ask an AI instead, like ChatGPT, Perplexity, or Gemini, and act on whatever answer comes back, often without checking a second source. Even when making a purchase decision, buyers rely on AI. The response is assembled from […]
Beyond the Death: Turning Obituary Data Into Fraud Detection Signals
Every year, pension funds and insurers pay out benefits to people who are no longer alive to receive them. The infrastructure meant to catch a death hasn’t caught up yet, so checks keep getting cut and policies stay active while the record goes unverified. The Social Security Death Master File (DMF) is the default source […]

Competitor Location Monitoring at Scale: Tracking Dealer Network Change Over Time
Markets shift constantly, and most of that shifting happens quietly. A competitor expands into a new region, pulls back from another, and neither move comes with an announcement. For a manufacturer trying to track where rivals are gaining ground, the only real signal is where their dealers show up next. But here’s the thing: a […]

The Hidden Number: How Grepsr Cracked Real-Time Stock Data for a Major Retail Network
Some websites don’t hide their data behind a locked door; they hide it behind a maze. A major retailer’s stock levels were never listed anywhere on its site; the only way to find the real number was to keep adding items to a cart until it broke. This is how Grepsr turned that breaking point […]
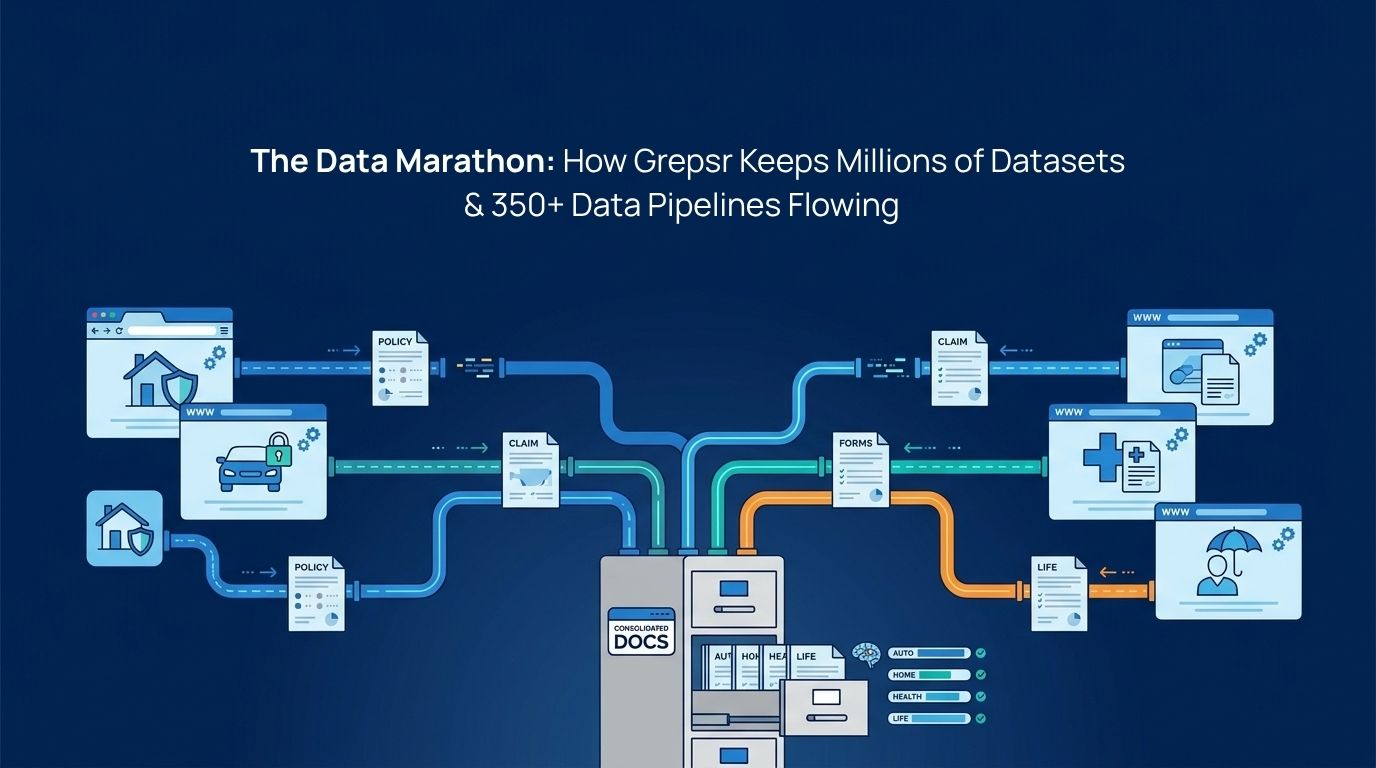
The Data Marathon: How Grepsr Keeps Millions of Health Insurance Records and 350+ Data Pipelines Flowing
A partnership story from the health insurance data industry When a New York-based health insurance data and API platform set out to build a standardised data layer for the employee benefits industry, the product vision was straightforward: Give brokers, benefits administrators, and health insurance carriers a single, standardised data layer including provider networks, plan details, […]
Web Scraping for Competitive Market Insights: Powering $3 Billion in EBITDA Through Data-Driven Pricing
Setting prices for products is similar to adjusting the sails on a boat. If you don’t read the wind properly, you’ll either be stuck in place or heading in the wrong direction. Data is the wind that helps you steer a steady course. In an economy where every dollar counts, businesses can’t afford to guess […]
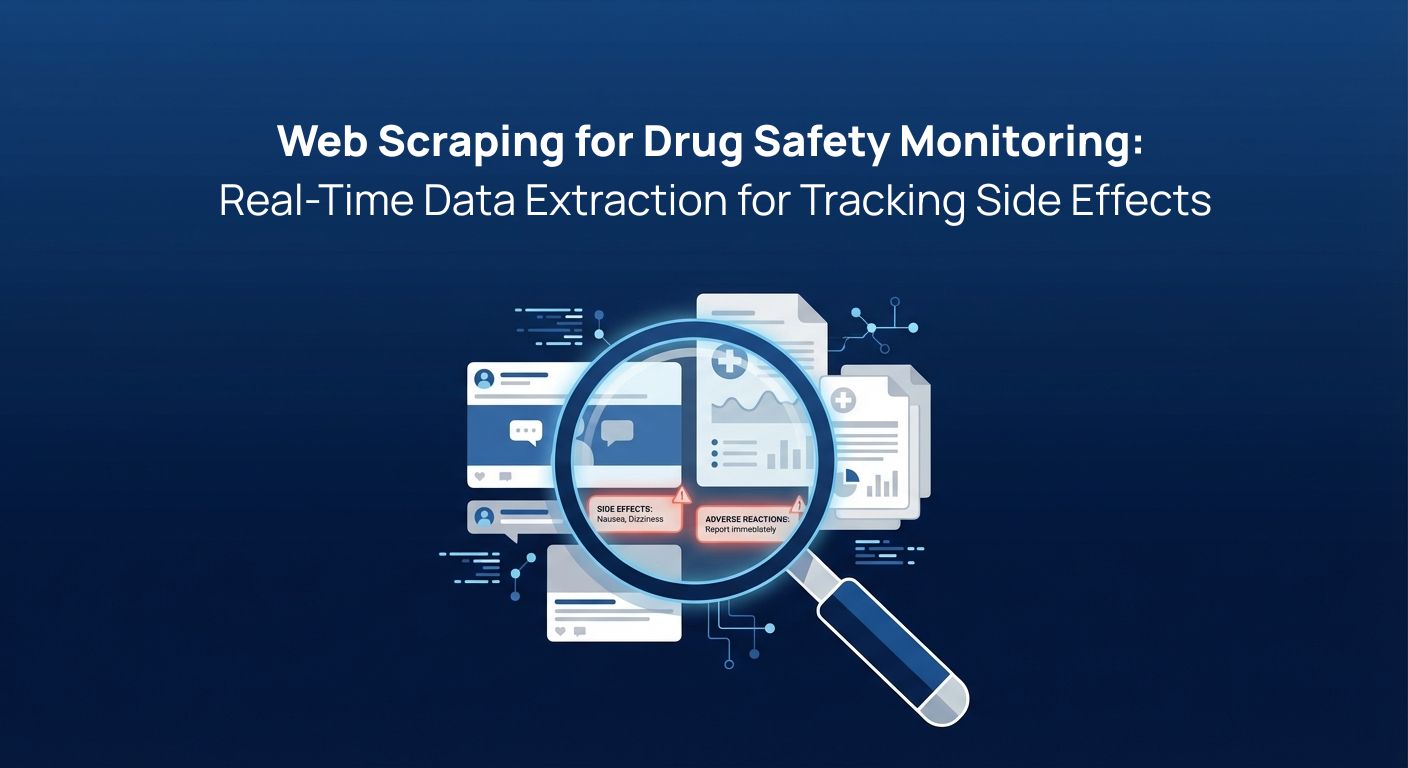
Web Scraping for Drug Safety Monitoring: Real-Time Data Extraction for Tracking Side Effects
Quick Summary: Web scraping and public web data extraction can help pharmaceutical companies detect drug side effects faster by monitoring publicly available discussions and medical publications. This case study explains how a pharma company used web scraping to collect real-time signals about adverse drug reactions and turn scattered public information into structured safety data. Imagine […]

Analyzing Celebrity Impact on Consumer Behavior through Social Media Data: Taylor’s Version
This case study takes a deep dive into the powerful influence of global pop star –Taylor Swift. By extracting social media data using carefully selected keywords and hashtags, we analyze patterns and trends that reflect the powerful gravitational pull of her influence on consumers. Continue reading for jaw-dropping insights. The Power of Celebrity Influence Celebrities […]
Boosting Efficiency and Accuracy: The Power of AI Data Validation for E-commerce Growth
In e-commerce, one wrong product detail can cost you a sale, or worse, a customer’s trust. As businesses scale, ensuring the accuracy and consistency of their data becomes an increasingly complex challenge. Similarly, for a growing electronics retailer, managing an expanding catalog of products with manual data validation was a recipe for errors, delays, and […]
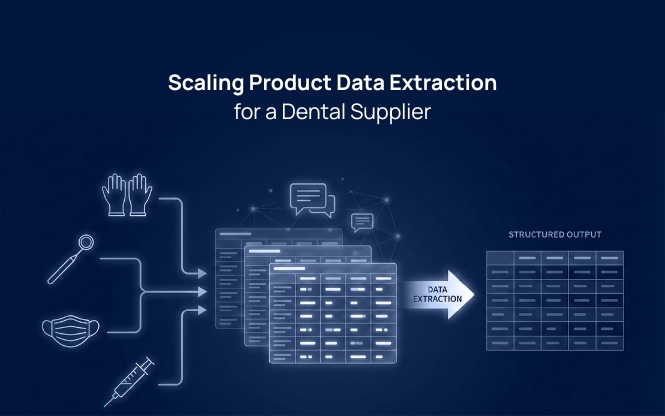
How Proactive Communication Scaled a Product Data Extraction Project for a Dental Supplier
The dental products retail industry is thriving in the online business sector. As more dental professionals turn to digital platforms for sourcing products, those who can harness the power of big data are gaining a competitive edge. One of the most effective ways to leverage this data is through product data extraction—the process of automatically […]
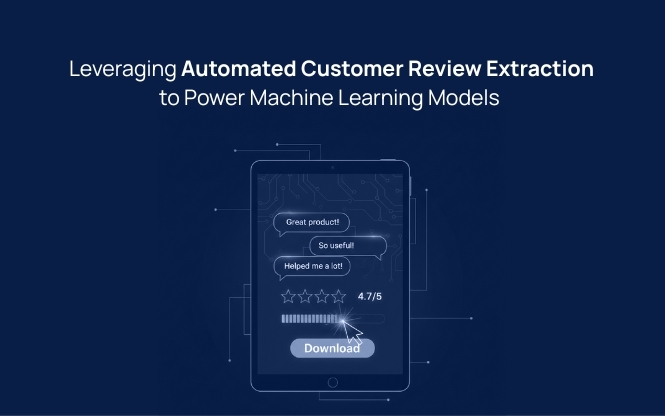
How a Leading Consumer Electronics Company Leveraged Automated Customer Review Extraction
Customer reviews serve as the backbone of product development and consumer insights. For one leading consumer electronics brand, these reviews were essential for fueling machine learning models that perform sentiment analysis and inform key business decisions. However, the frequent removal of reviews by platforms due to policy violations creates significant challenges, leaving gaps in the […]
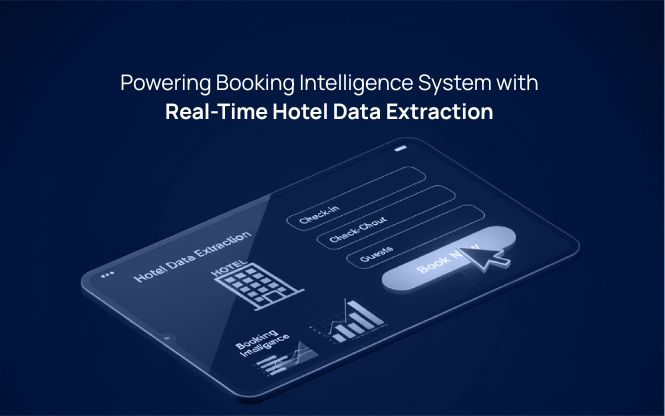
Powering a Booking Intelligence System with Real-Time Hotel Data Extraction
In the travel industry, booking data is the pulse that reveals how markets move. It captures the patterns of demand, competition, and consumer intent like who’s booking, where, when, and at what price. This information fuels dynamic pricing, helps forecast occupancy, and enables travel platforms and hotels to anticipate market shifts rather than react to […]
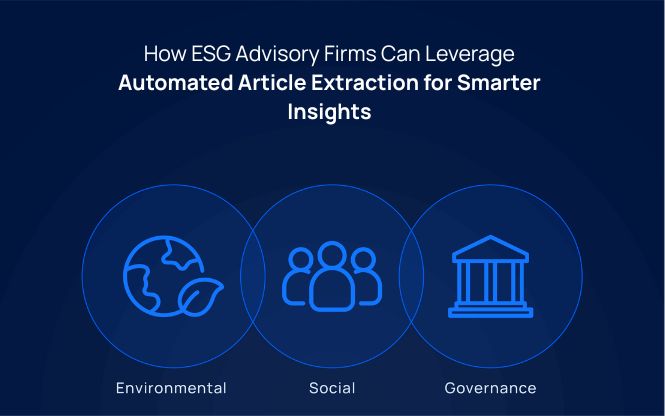
How ESG Advisory Firms Can Leverage Automated Article Extraction for Smarter Insights
Government websites and official press releases are goldmines for ESG (Environmental, Social, Governance) intelligence. Every update – whether it’s a new regulation, policy amendment, or court directive can shape how ESG advisory firms advise their clients. Yet, these updates are scattered across hundreds of government portals, each with its own format, language, and publishing schedule. […]

Seamless Vehicle Data Extraction for a Leading Automotive Intelligence Provider
In the automotive industry, having access to comprehensive, real-time vehicle information is essential for making informed decisions. However, gathering this data from online sources comes with many challenges, such as security barriers, IP restrictions, and complex firewall configurations. These can significantly disrupt the flow of critical data needed to support key business operations. In this […]
High-Coverage POI Data Extraction For Powering FMCG Market Strategy
Finding the right retail locations is a lot like navigating a city without street signs – you might eventually reach your destination, but not without wasted time, missed turns, and lost opportunities. Points of Interest (POI) data acts as those street signs, offering clear visibility into where consumers shop, dine, and gather. For global brands […]
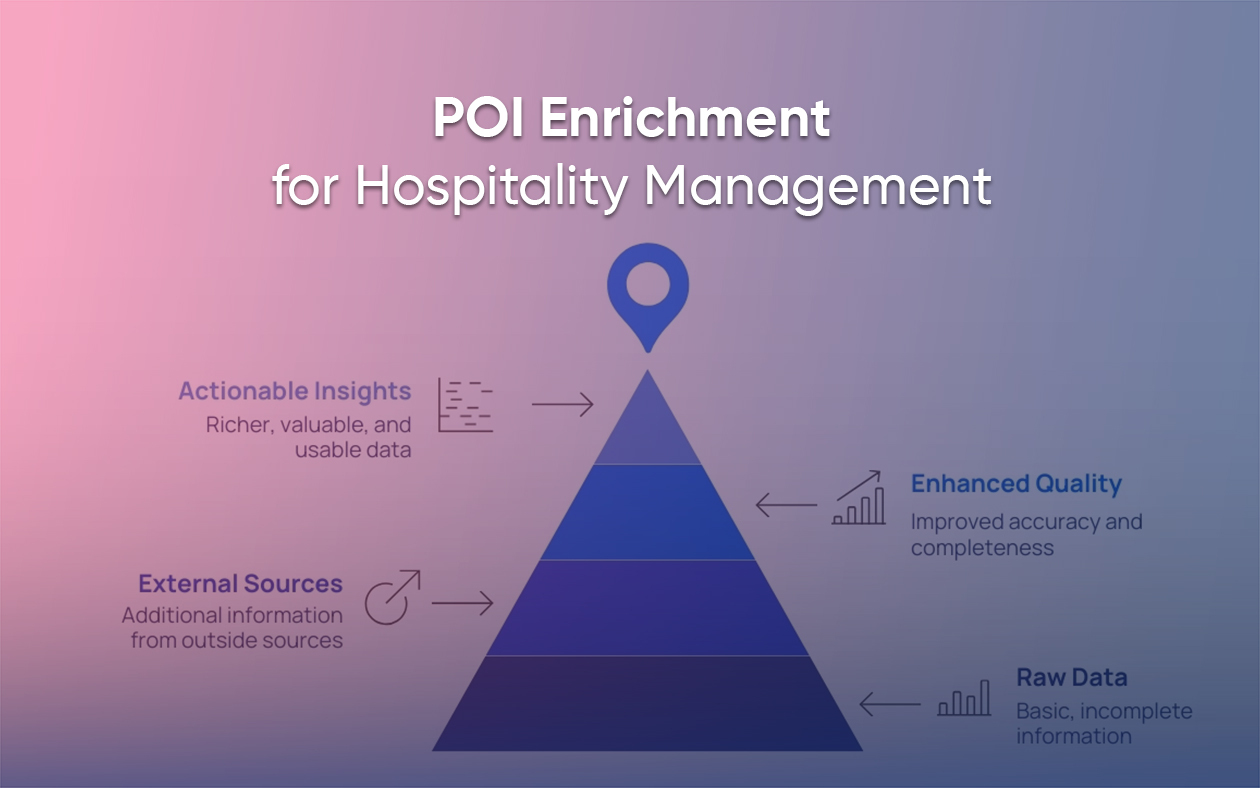
POI Data Enrichment for a Leading Hospitality Management Company
Data is valuable, but enriched data is priceless. Data enrichment is the process of adding value and further information to an existing dataset to improve its quality, accuracy, and completeness. It involves taking raw, incomplete data and enhancing it with additional and meaningful information from external sources. It turns a basic dataset into something richer, […]
Top Six E-commerce Datasets: Web Scraping Use Cases
The irreversible rise of e-commerce has been a similar phenomenon around the world. In 1998, the entirety of the e-commerce market stood at just $5 billion.
Location Intelligence in Retail: Real Use Cases From Grocery Stores
Do you know what separates successful retailers from the ones that are closing down? One key factor is using location intelligence in retail to make informed decisions. Modern retailers scrape the internet to find out competitor store hours, demographic shifts, and foot traffic patterns to find impactful location strategies. And the numbers back it up. […]
Shaping Organizational Culture with Glassdoor Data
Glassdoor Data offers a detailed look into organizational culture by analyzing employee reviews and ratings. This data provides insights into company dynamics, regional trends, and the impact of major events, helping businesses improve employee satisfaction and cultural alignment. Netflix’s culture deck, crafted by Reed Hastings, champions employee autonomy and creativity, even offering unlimited vacations as […]
How Web Scraping Saved a Vehicle Data Platform
How Grepsr rescued a vehicle data platform from a major OEM block—restoring 100% uptime, 99.9% data accuracy, and real-time API performance for VIN checks and insurance quotes.
Mapping LA Wildfire Impact with POI Data
POI data extraction and reverse geocoding transformed wildfire impact maps into precise addresses, enabling targeted disaster relief.
How a Real Estate Agency Gained Competitive Intelligence with Real-Time High-Quality Datasets
Gathering structured real estate data from various government sites and public records at scale poses significant challenges.
What Is Shipping Data & Why It’s Critical for Logistics Performance
Before the pandemic, the global supply chain relied on predictable inventory flows. There was high schedule reliability, which meant the carriers usually followed the same schedules. This ensured the arrival of inventory in time, replenishment of stores, and constant operation of the factories.
Unraveling Job Market Dynamics: Leveraging Data Analytics for Competitive Edge
The notion of hiring the “right” candidate needs clarification of what’s “right” for your organization. Starting from the alignment of values, motivation, ambition, and technical skills required for the position.
Enabling Market Expansion: Data Refinement at Grepsr
Any data is only as good as the insights derived from it. However, before we begin the analysis, the data must be put through adequate pre-processing techniques that standardize, aggregate, and categorize the dataset.
Introduction to Web Scraping & RPA
Web scraping automatically extracts structured data like prices, product details, or social media metrics from websites. Robotic Process Automation (RPA) focuses on automating routine and repetitive tasks like data entry, report generation, or file management.

Car Rental Data Unwrapped: Merry Miles and the Christmas Story in the UK
Delve into the festive drive as we analyze 50K+ car rental records from ‘Sixt – Rent a Car’ during December 2023. From the holiday surges on Christmas Eve to discovering budget-friendly gems like the Kia Picanto, come with us as we decode the Merry Miles of Christmas car rentals in the UK.
NYC POI Data Dynamics: Decoding Impermanence
Geographical locations or POIs are not entities that last for posterity. We collected NYC POI data to decode the various dynamics that may help executives make informed decisions within the backdrop of impermanence.
Revving Up for E-commerce Success in Q4: Leverage Web Scraping
Inflationary pressures, rising prices, and the looming possibility of an impending recession have dealt an unwarranted blow to e-commerce sales over the last three quarters.
Harnessing POI Insights: The Web Scraping Advantage
Points of Interest (POIs) are more than just points on a map. They are filled to the brim with actionable data like addresses, names, contact details, and working hours. POI data also includes images, which add a visual component to the data. With web scraping, you can get the advantage you need to harness POI insights.
Analyzing US Job Postings Data to Understand Job Market & Economy
The US economy was forecast to spiral into a recession in 2023. Yet, despite fears, if current job listings and hiring trends are to be believed, the current economic reality appears to be quite different. The robust nature of the current US job market is proving to be one of the main drivers of the country’s strong economy.
