

Search here
Can't find what you are looking for?
Feel free to get in touch with us for more information about our products and services.
Mapping LA Wildfire Impact with POI Data
Background
Raging wildfires swept through LA in January, causing massive property losses expected to exceed $130 billion and claiming about 30 lives as of February.
While multiple factors contributed to this catastrophe, the primary cause has been linked to Climate Whiplash—a phenomenon where unusually wet years are followed by extreme drought, creating the perfect conditions for wildfires.
Authorities worked tirelessly to contain the fires, while communities and organizations came together to raise funds and support rehabilitation efforts.
In this context, we received an unusual request. A social services professional needed to monitor affected addresses using a web-based map. He requested a spreadsheet containing critical data points, including the ‘scale of destruction’ or ‘percentage of devastation’, to better allocate relief funds.
Additionally, he sought neighborhood-specific details such as house number, road, town, county, and even the full address.
However, obtaining neighborhood-level data to measure the impact proved more challenging than expected. Ultimately, we had to use reverse geocoding to convert coordinates into full addresses.
This case involved both extracting POI data and processing it.
Let’s dive in.

Challenge
Our task was clear: deliver neighborhood-specific POI data to generate critical insights into the LA fires and support relief efforts.
However, the map provided by the social services professional was incomplete.
The map looked like this:
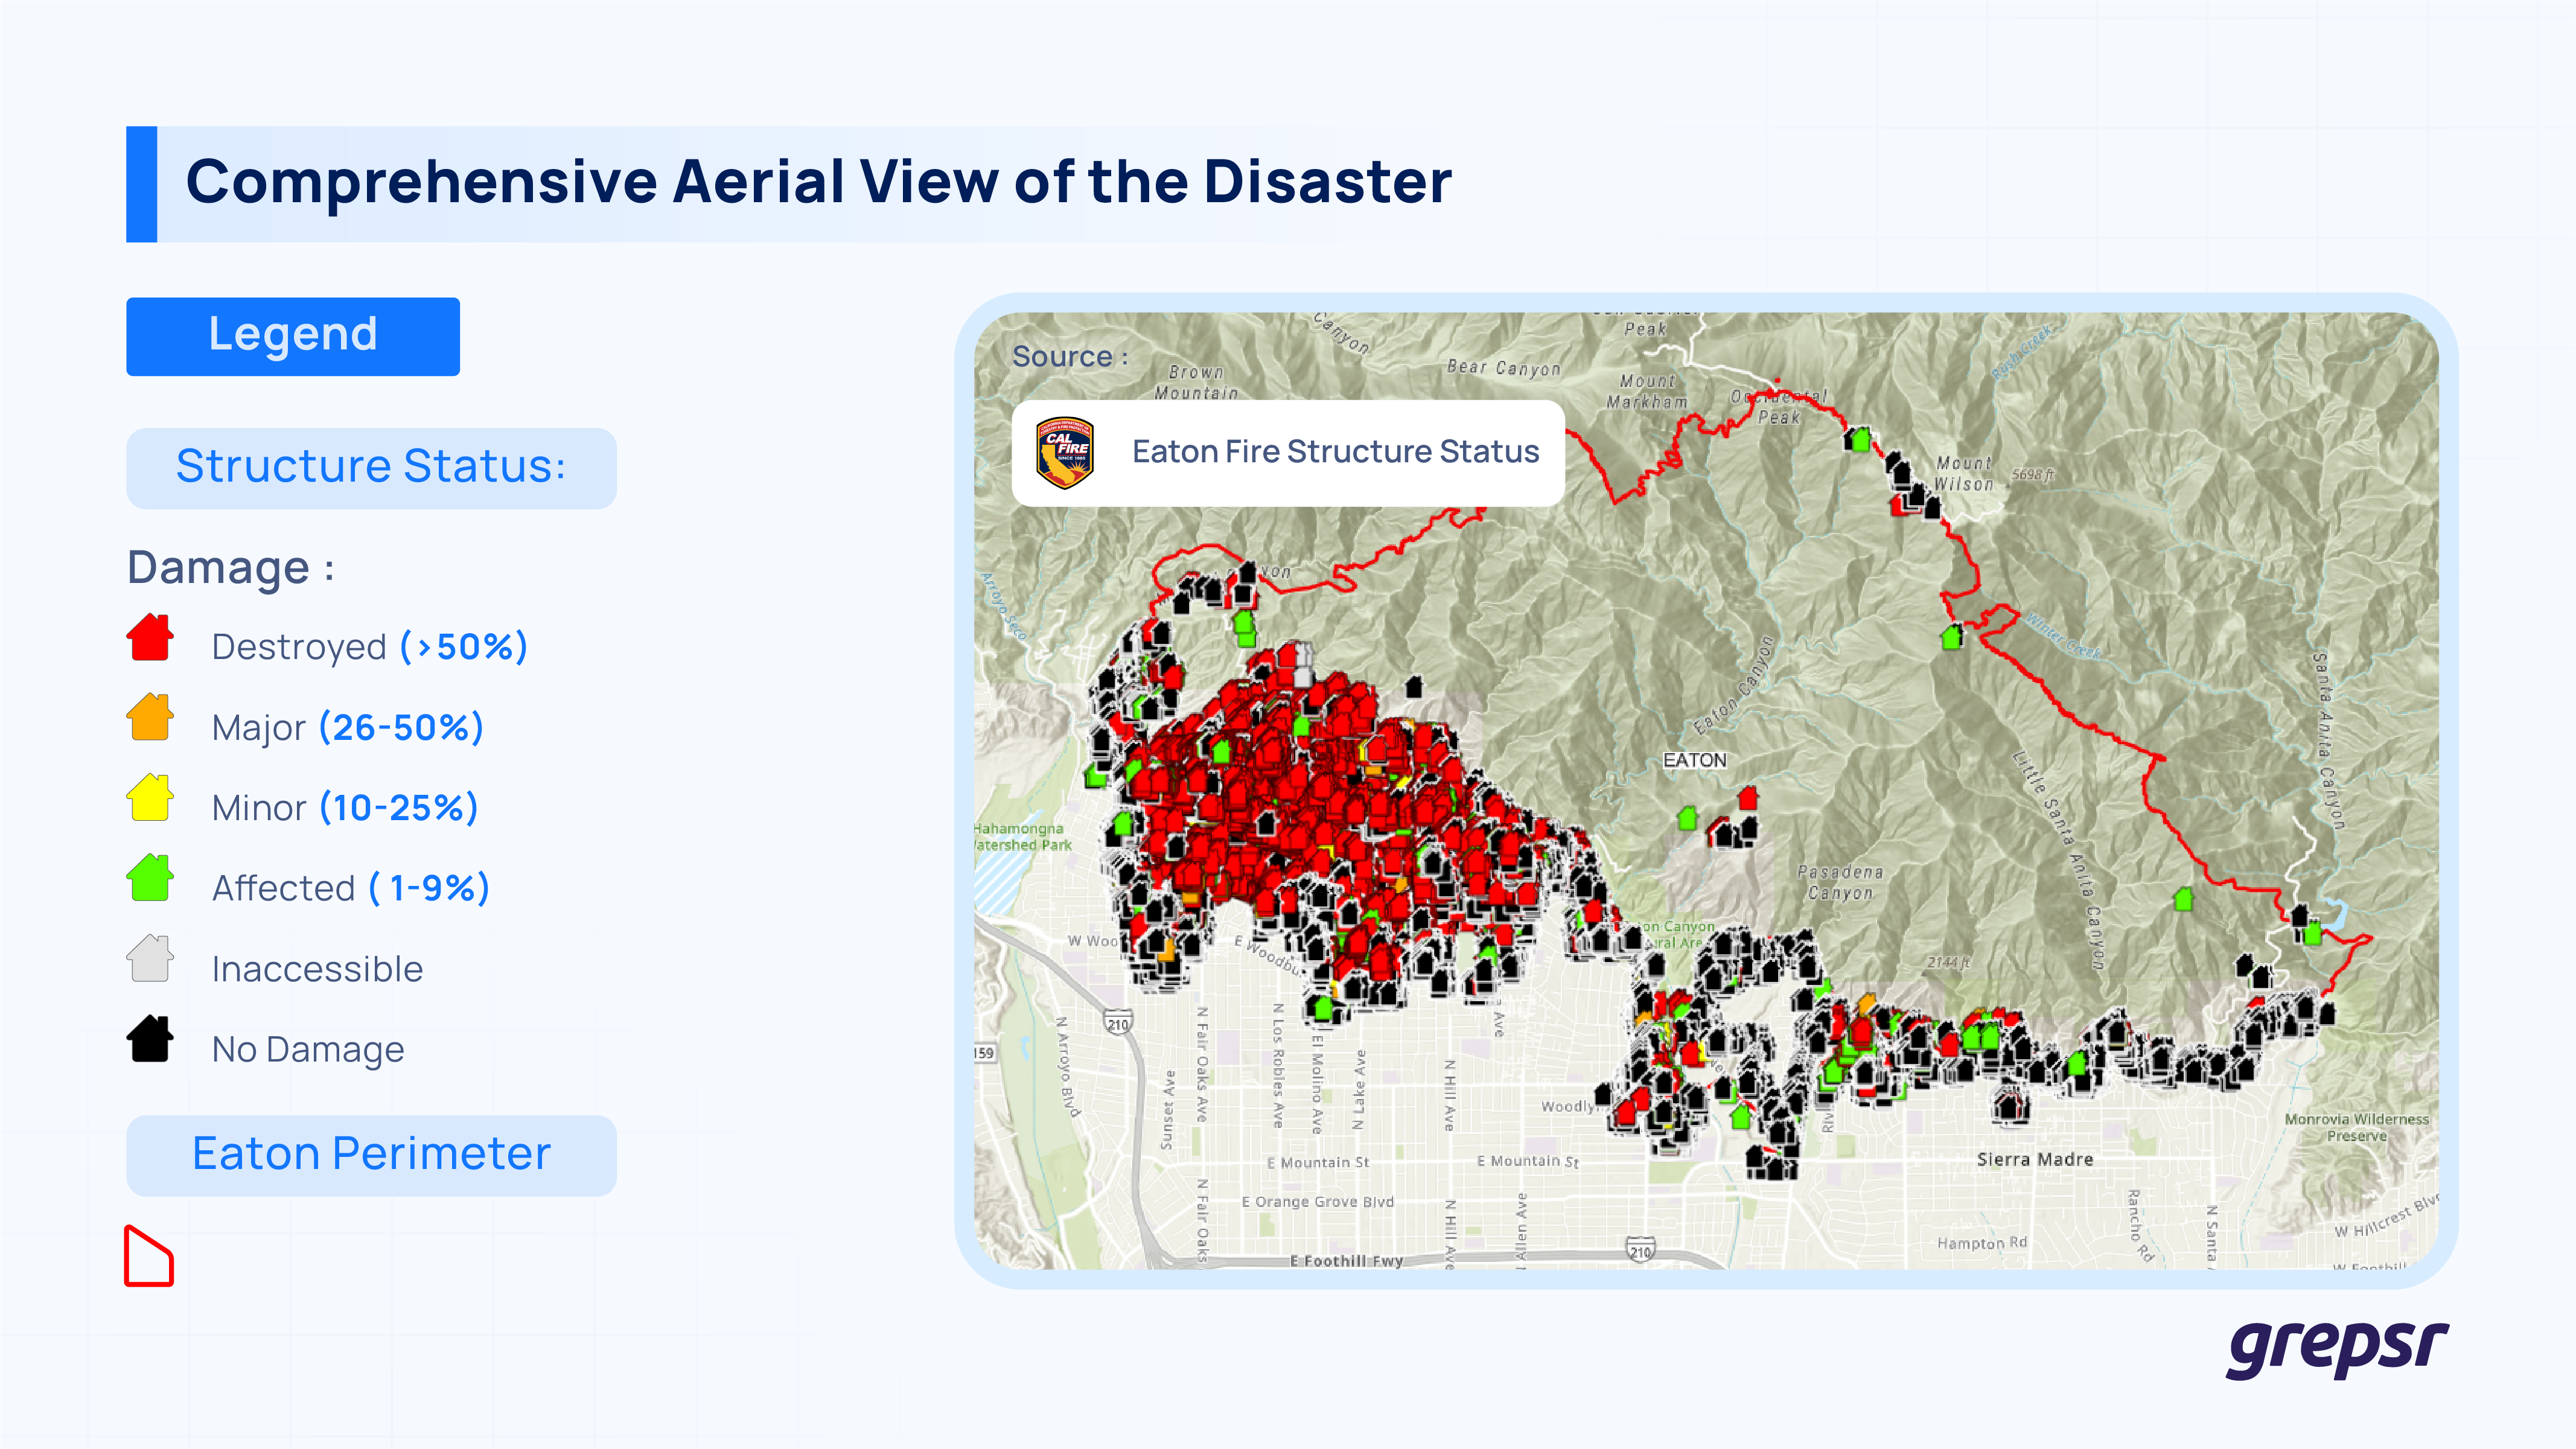
Although it provided a comprehensive aerial view of the disaster, the actionable data was limited to geographic coordinates and damage assessments.
The real challenge was extracting neighborhood-specific details—structure type, full address, house number, road, town, and county.
Without these granular POI data points, coordinating effective relief efforts would be nearly impossible.
Solution
We collected latitude and longitude data for points of interest (POIs) from the map and then used reverse geocoding to convert those coordinates into full addresses.
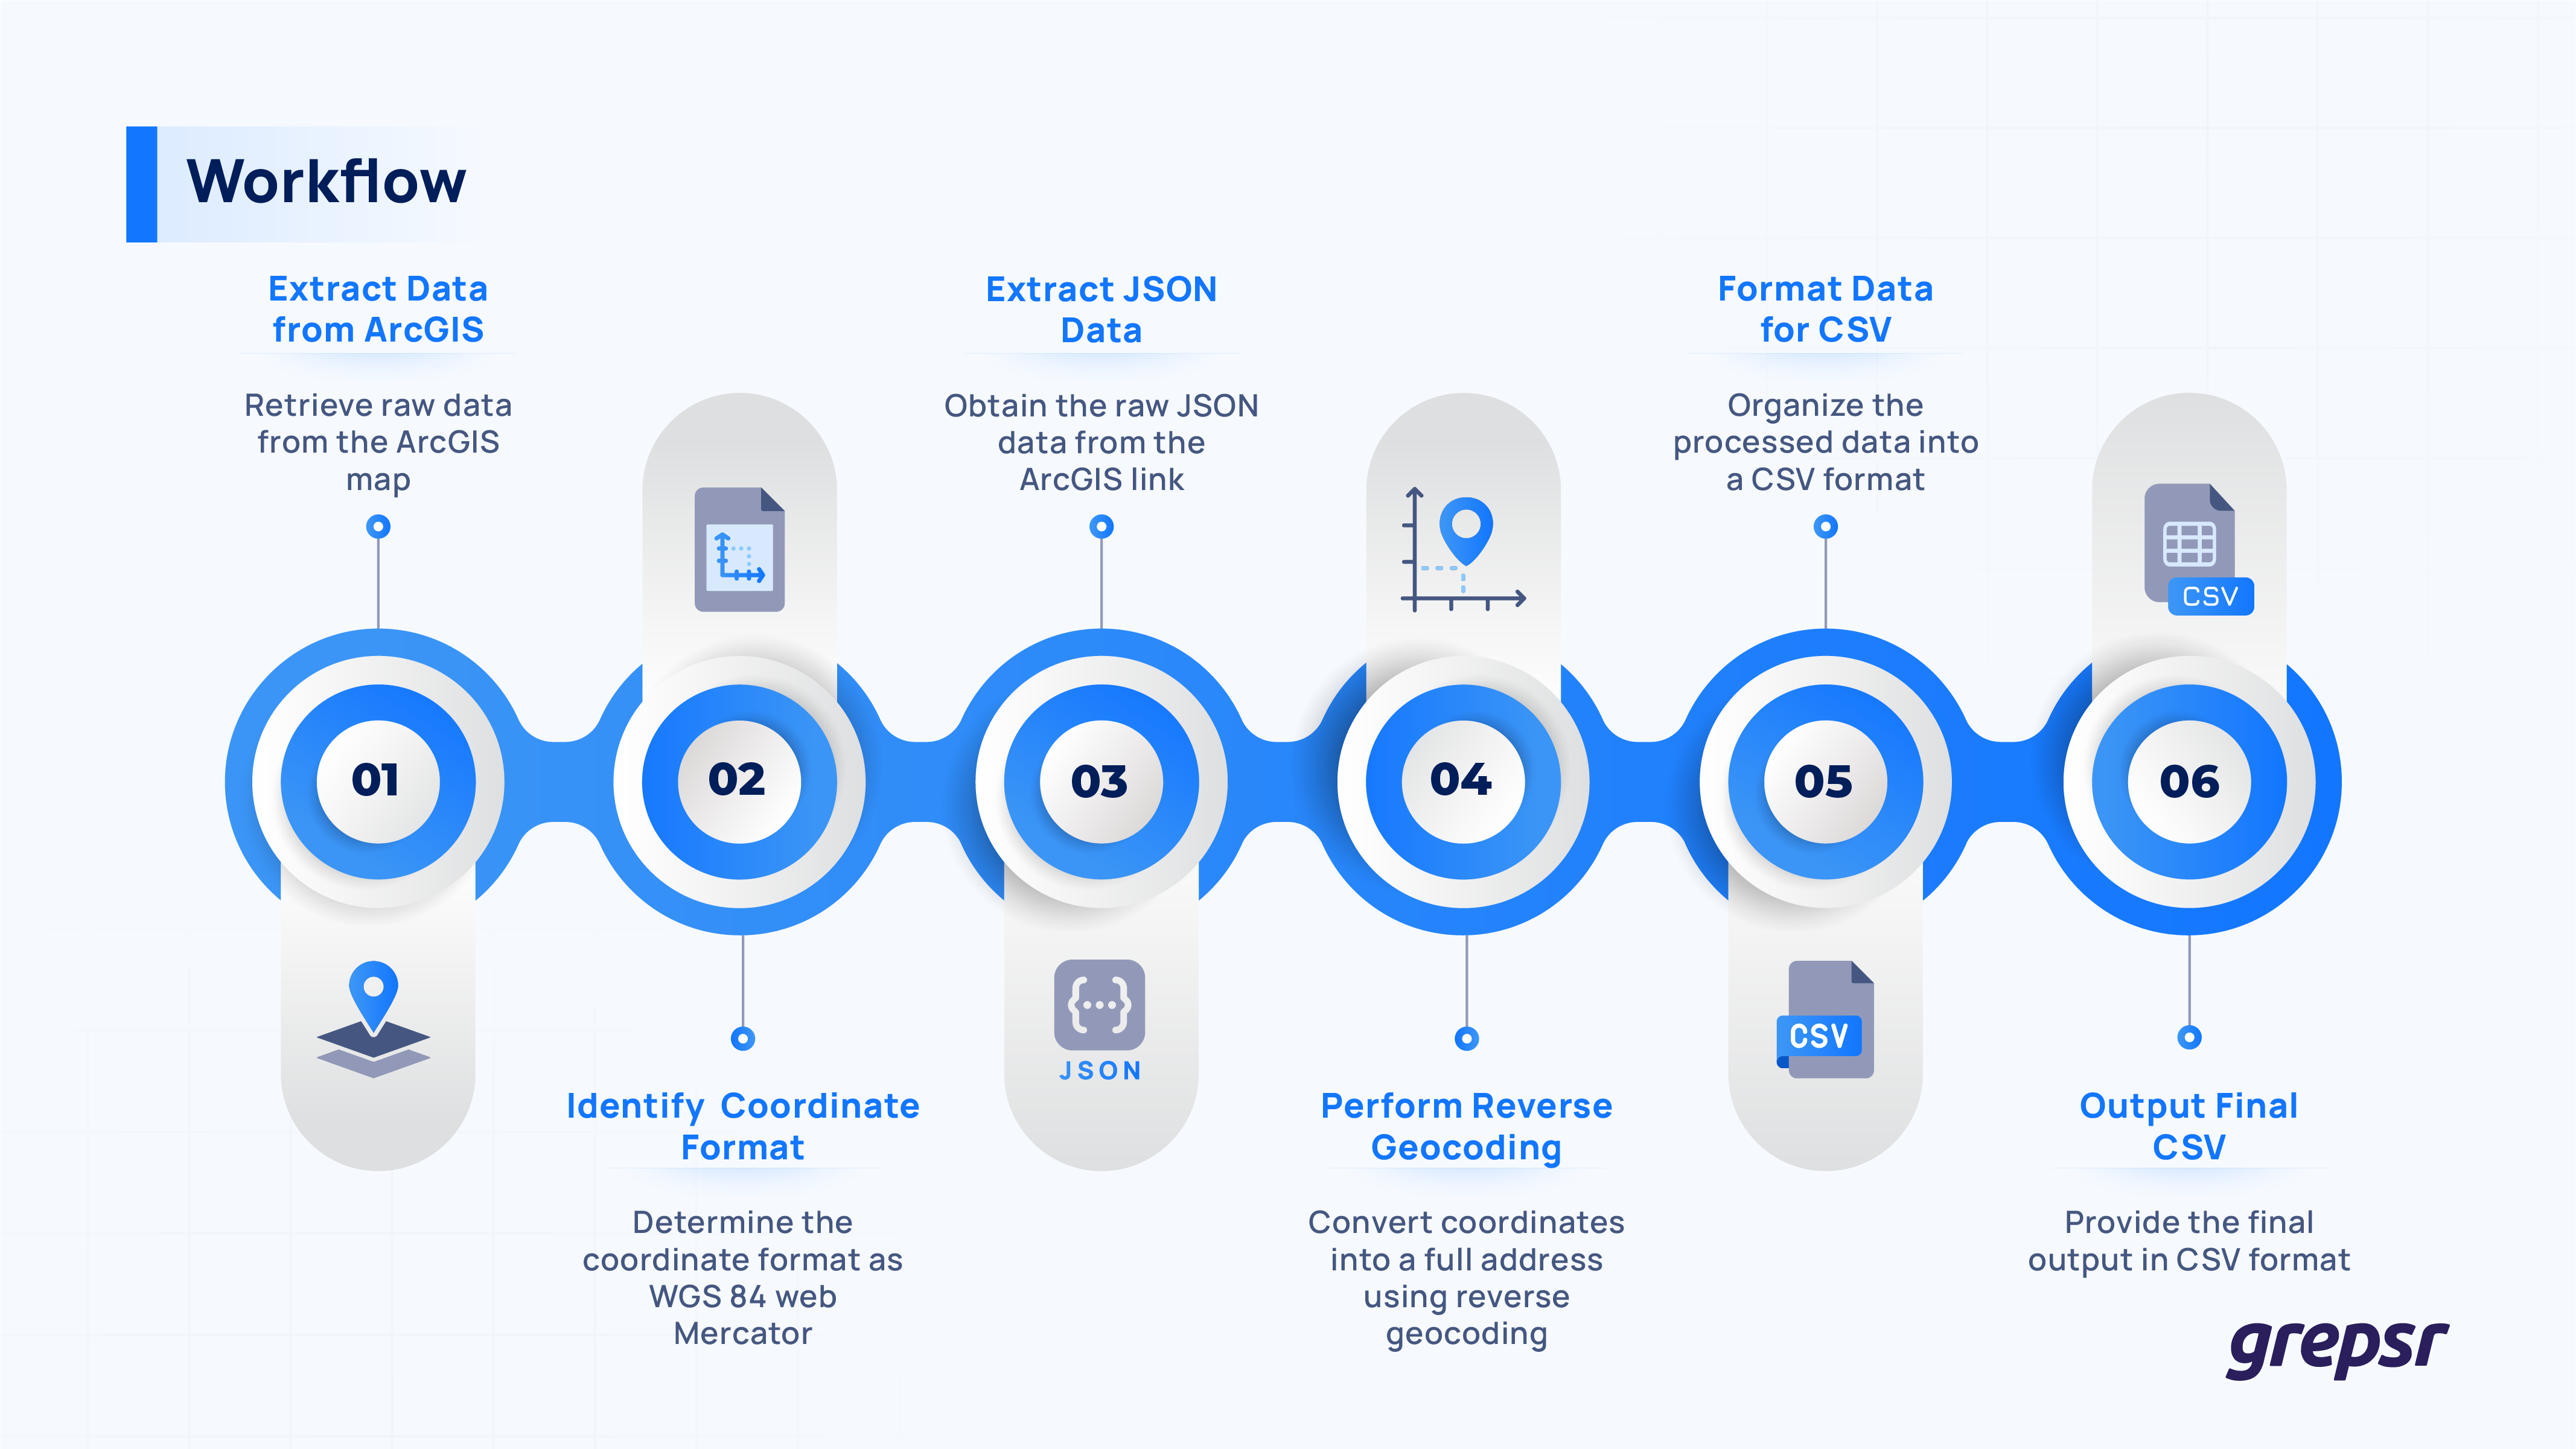
- Data Extraction from a Web-based Map: First, we worked with a web-based ArcGIS map to extract raw geographic data. ArcGIS is a tool that helps with mapping and spatial analysis. The data we pulled includes coordinates (latitude and longitude) that represent different points on the map.
- Identifying Coordinate Format (WGS 84): The next step was to figure out the coordinate system used by the data. We determined that it was in the WGS 84 format, which is a standard coordinate system used by GPS.
- Extracting Data from JSON: The data we needed was stored in the JSON format. We accessed the ArcGIS link to pull this data into a usable format for further processing.
- Reverse Geocoding: This is the crucial step in the process. We leveraged reverse geocoding through the OpenStreetMap API to transform the coordinates (latitude and longitude) into a complete address. For example, instead of just getting the location as a set of numbers (like “40.7128, -74.0060”), reverse geocoding translates those numbers into something like “New York City, NY.”
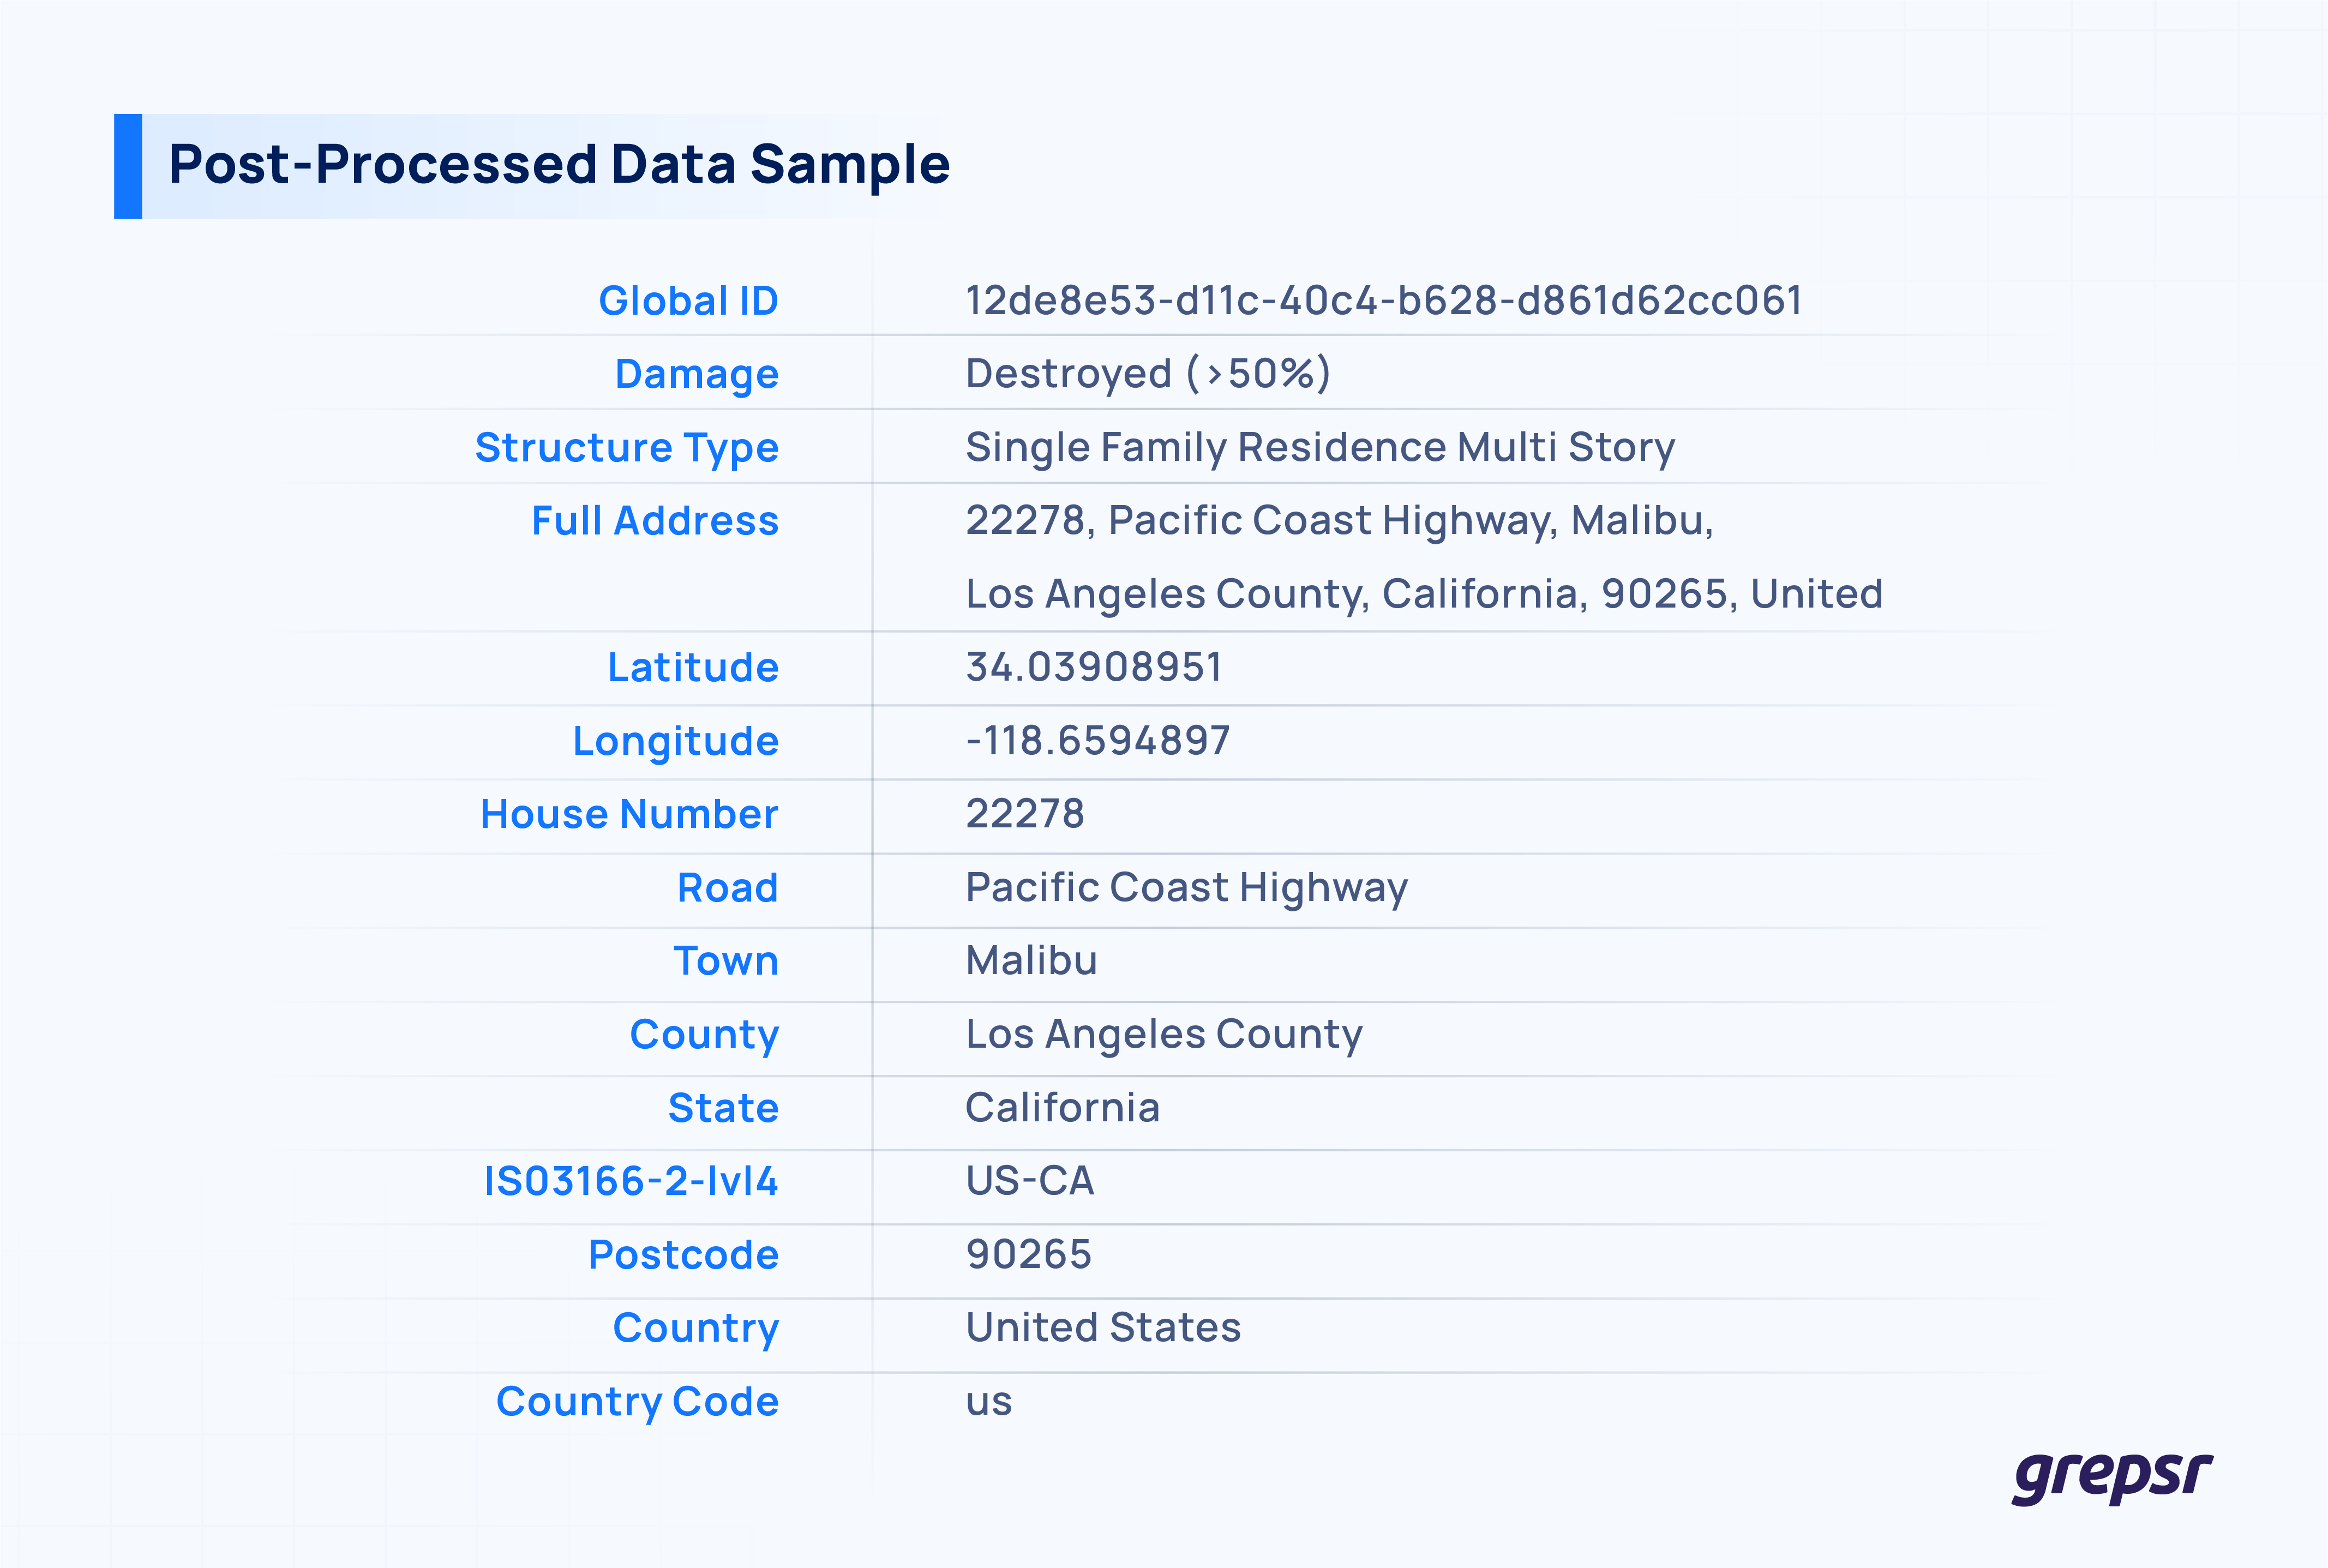
- Final Output in CSV: After the reverse geocoding process, we compiled the results into a CSV file. This file includes the addresses of the buildings and infrastructure, making it easier to identify the locations that need attention.
Impact
The conversion of raw geographic POI data into actionable neighborhood-level information had a significant impact on the LA fire relief efforts.
By using reverse geocoding to transform latitude and longitude coordinates into detailed addresses, we provided the social services professional with the critical data needed to identify the most affected areas.
The CSV file, now containing full addresses and specific neighborhood details, allowed for more accurate targeting of relief efforts.
This enabled better allocation of funds, timely delivery of aid, and a more organized response to disaster.
Furthermore, the granular data helped prioritize rebuilding efforts, ensuring the areas with the highest devastation received immediate attention.
Shaping a prosperous future with data-driven decisions

The Hidden Number: How Grepsr Cracked Real-Time Stock Data for a Major Retail Network
Some websites don’t hide their data behind a locked door; they hide it behind a maze. A major retailer’s stock levels were never listed anywhere on its site; the only way to find the real number was to keep adding items to a cart until it broke. This is how Grepsr turned that breaking point […]
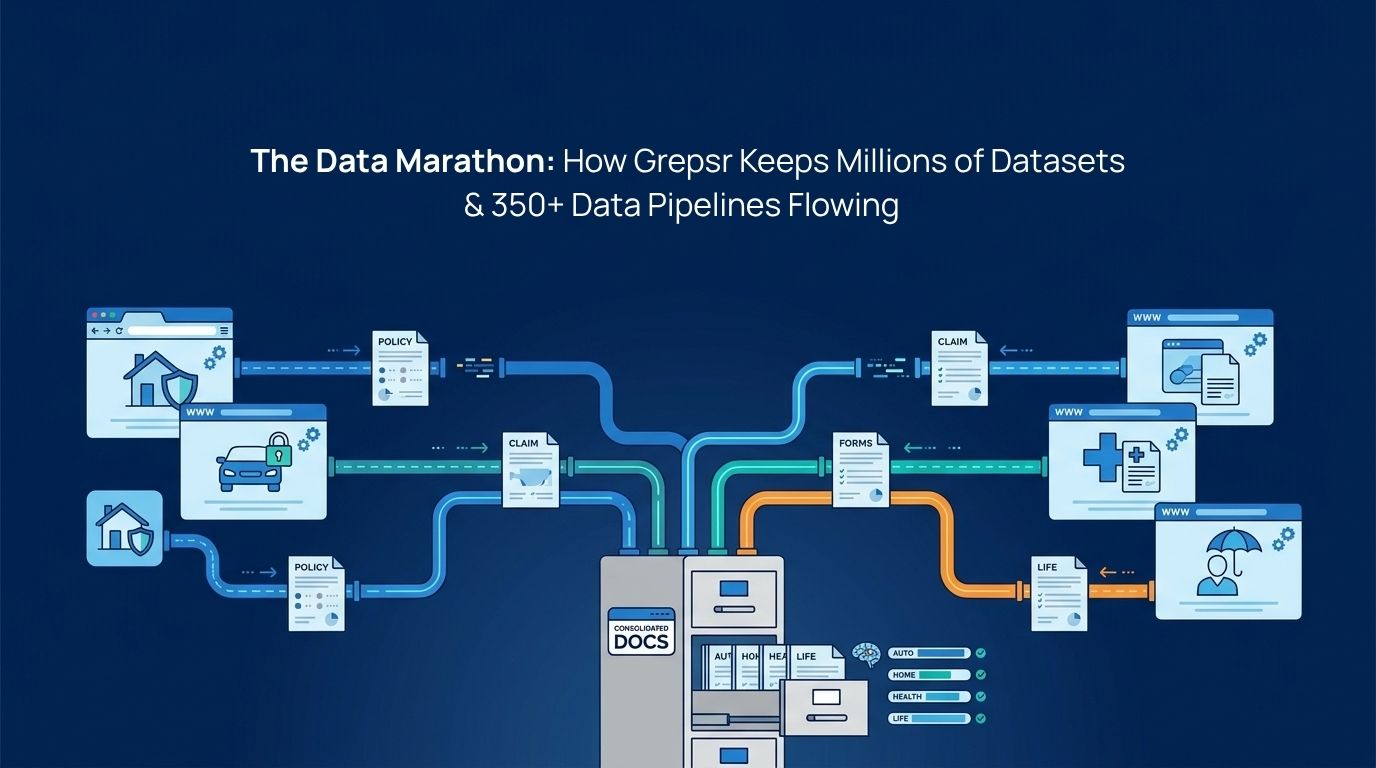
The Data Marathon: How Grepsr Keeps Millions of Health Insurance Records and 350+ Data Pipelines Flowing
A partnership story from the health insurance data industry When a New York-based health insurance data and API platform set out to build a standardised data layer for the employee benefits industry, the product vision was straightforward: Give brokers, benefits administrators, and health insurance carriers a single, standardised data layer including provider networks, plan details, […]
Web Scraping for Competitive Market Insights: Powering $3 Billion in EBITDA Through Data-Driven Pricing
Setting prices for products is similar to adjusting the sails on a boat. If you don’t read the wind properly, you’ll either be stuck in place or heading in the wrong direction. Data is the wind that helps you steer a steady course. In an economy where every dollar counts, businesses can’t afford to guess […]
Web Scraping for Drug Safety Monitoring: Real-Time Data Extraction for Tracking Side Effects
Quick Summary: Web scraping and public web data extraction can help pharmaceutical companies detect drug side effects faster by monitoring publicly available discussions and medical publications. This case study explains how a pharma company used web scraping to collect real-time signals about adverse drug reactions and turn scattered public information into structured safety data. Imagine […]

Analyzing Celebrity Impact on Consumer Behavior through Social Media Data: Taylor’s Version
This case study takes a deep dive into the powerful influence of global pop star –Taylor Swift. By extracting social media data using carefully selected keywords and hashtags, we analyze patterns and trends that reflect the powerful gravitational pull of her influence on consumers. Continue reading for jaw-dropping insights. The Power of Celebrity Influence Celebrities […]

Boosting Efficiency and Accuracy: The Power of AI Data Validation for E-commerce Growth
In e-commerce, one wrong product detail can cost you a sale, or worse, a customer’s trust. As businesses scale, ensuring the accuracy and consistency of their data becomes an increasingly complex challenge. Similarly, for a growing electronics retailer, managing an expanding catalog of products with manual data validation was a recipe for errors, delays, and […]
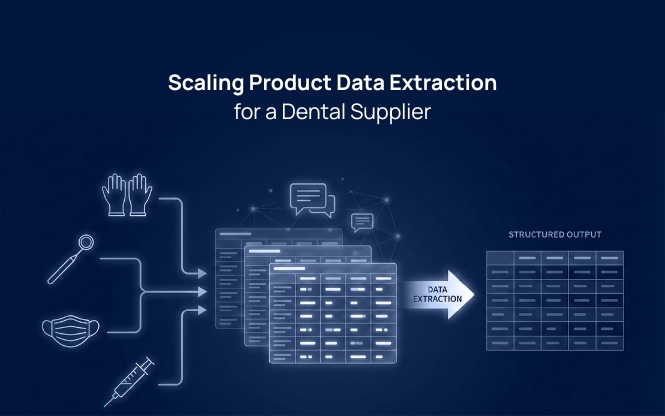
How Proactive Communication Scaled a Product Data Extraction Project for a Dental Supplier
The dental products retail industry is thriving in the online business sector. As more dental professionals turn to digital platforms for sourcing products, those who can harness the power of big data are gaining a competitive edge. One of the most effective ways to leverage this data is through product data extraction—the process of automatically […]
How a Leading Consumer Electronics Company Leveraged Automated Customer Review Extraction
Customer reviews serve as the backbone of product development and consumer insights. For one leading consumer electronics brand, these reviews were essential for fueling machine learning models that perform sentiment analysis and inform key business decisions. However, the frequent removal of reviews by platforms due to policy violations creates significant challenges, leaving gaps in the […]
Powering a Booking Intelligence System with Real-Time Hotel Data Extraction
In the travel industry, booking data is the pulse that reveals how markets move. It captures the patterns of demand, competition, and consumer intent like who’s booking, where, when, and at what price. This information fuels dynamic pricing, helps forecast occupancy, and enables travel platforms and hotels to anticipate market shifts rather than react to […]
How ESG Advisory Firms Can Leverage Automated Article Extraction for Smarter Insights
Government websites and official press releases are goldmines for ESG (Environmental, Social, Governance) intelligence. Every update – whether it’s a new regulation, policy amendment, or court directive can shape how ESG advisory firms advise their clients. Yet, these updates are scattered across hundreds of government portals, each with its own format, language, and publishing schedule. […]

Seamless Vehicle Data Extraction for a Leading Automotive Intelligence Provider
In the automotive industry, having access to comprehensive, real-time vehicle information is essential for making informed decisions. However, gathering this data from online sources comes with many challenges, such as security barriers, IP restrictions, and complex firewall configurations. These can significantly disrupt the flow of critical data needed to support key business operations. In this […]

High-Coverage POI Data Extraction For Powering FMCG Market Strategy
Finding the right retail locations is a lot like navigating a city without street signs – you might eventually reach your destination, but not without wasted time, missed turns, and lost opportunities. Points of Interest (POI) data acts as those street signs, offering clear visibility into where consumers shop, dine, and gather. For global brands […]
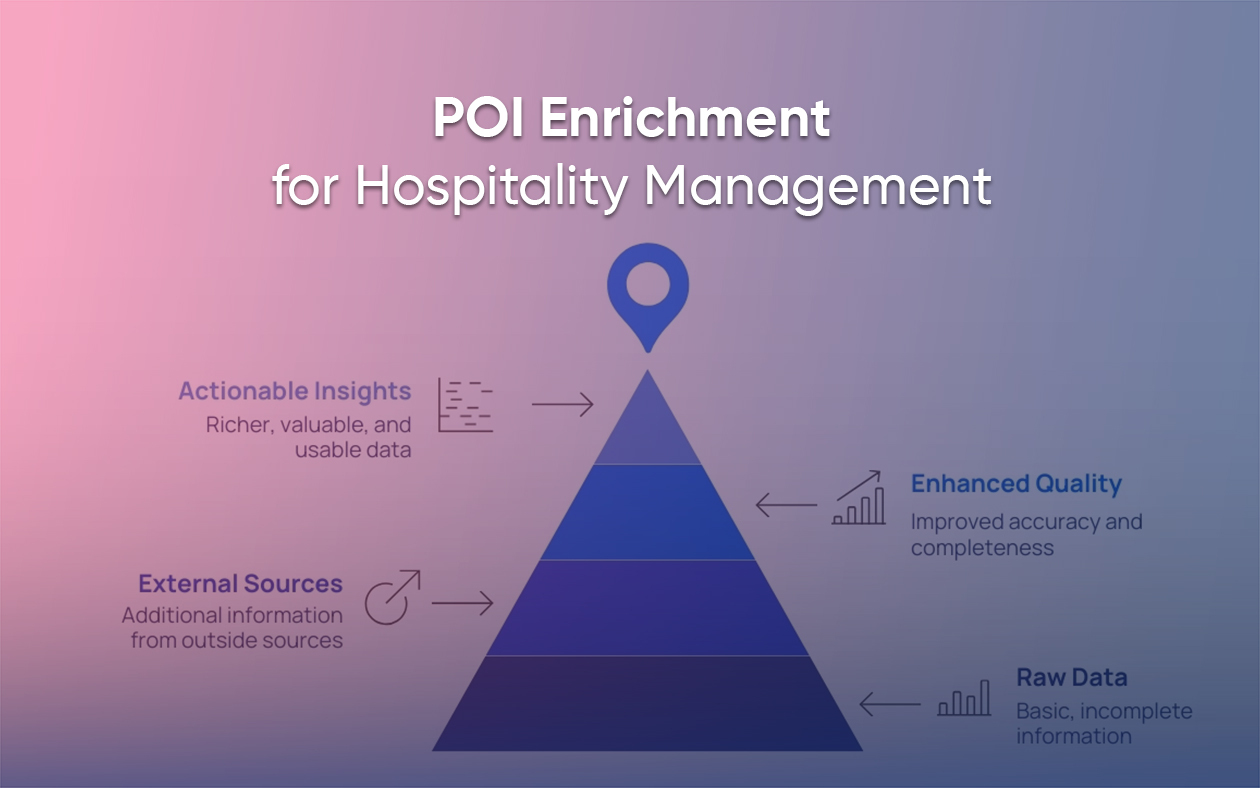
POI Data Enrichment for a Leading Hospitality Management Company
Data is valuable, but enriched data is priceless. Data enrichment is the process of adding value and further information to an existing dataset to improve its quality, accuracy, and completeness. It involves taking raw, incomplete data and enhancing it with additional and meaningful information from external sources. It turns a basic dataset into something richer, […]

Top Six E-commerce Datasets: Web Scraping Use Cases
The irreversible rise of e-commerce has been a similar phenomenon around the world. In 1998, the entirety of the e-commerce market stood at just $5 billion.
Location Intelligence in Retail: Real Use Cases From Grocery Stores
Do you know what separates successful retailers from the ones that are closing down? One key factor is using location intelligence in retail to make informed decisions. Modern retailers scrape the internet to find out competitor store hours, demographic shifts, and foot traffic patterns to find impactful location strategies. And the numbers back it up. […]
Shaping Organizational Culture with Glassdoor Data
Glassdoor Data offers a detailed look into organizational culture by analyzing employee reviews and ratings. This data provides insights into company dynamics, regional trends, and the impact of major events, helping businesses improve employee satisfaction and cultural alignment. Netflix’s culture deck, crafted by Reed Hastings, champions employee autonomy and creativity, even offering unlimited vacations as […]

How Web Scraping Saved a Vehicle Data Platform
How Grepsr rescued a vehicle data platform from a major OEM block—restoring 100% uptime, 99.9% data accuracy, and real-time API performance for VIN checks and insurance quotes.
How a Real Estate Agency Gained Competitive Intelligence with Real-Time High-Quality Datasets
Gathering structured real estate data from various government sites and public records at scale poses significant challenges.
What Is Shipping Data & Why It’s Critical for Logistics Performance
Before the pandemic, the global supply chain relied on predictable inventory flows. There was high schedule reliability, which meant the carriers usually followed the same schedules. This ensured the arrival of inventory in time, replenishment of stores, and constant operation of the factories.

Unraveling Job Market Dynamics: Leveraging Data Analytics for Competitive Edge
The notion of hiring the “right” candidate needs clarification of what’s “right” for your organization. Starting from the alignment of values, motivation, ambition, and technical skills required for the position.

Enabling Market Expansion: Data Refinement at Grepsr
Any data is only as good as the insights derived from it. However, before we begin the analysis, the data must be put through adequate pre-processing techniques that standardize, aggregate, and categorize the dataset.
Introduction to Web Scraping & RPA
Web scraping automatically extracts structured data like prices, product details, or social media metrics from websites. Robotic Process Automation (RPA) focuses on automating routine and repetitive tasks like data entry, report generation, or file management.

Car Rental Data Unwrapped: Merry Miles and the Christmas Story in the UK
Delve into the festive drive as we analyze 50K+ car rental records from ‘Sixt – Rent a Car’ during December 2023. From the holiday surges on Christmas Eve to discovering budget-friendly gems like the Kia Picanto, come with us as we decode the Merry Miles of Christmas car rentals in the UK.

NYC POI Data Dynamics: Decoding Impermanence
Geographical locations or POIs are not entities that last for posterity. We collected NYC POI data to decode the various dynamics that may help executives make informed decisions within the backdrop of impermanence.

Revving Up for E-commerce Success in Q4: Leverage Web Scraping
Inflationary pressures, rising prices, and the looming possibility of an impending recession have dealt an unwarranted blow to e-commerce sales over the last three quarters.

Harnessing POI Insights: The Web Scraping Advantage
Points of Interest (POIs) are more than just points on a map. They are filled to the brim with actionable data like addresses, names, contact details, and working hours. POI data also includes images, which add a visual component to the data. With web scraping, you can get the advantage you need to harness POI insights.
Analyzing US Job Postings Data to Understand Job Market & Economy
The US economy was forecast to spiral into a recession in 2023. Yet, despite fears, if current job listings and hiring trends are to be believed, the current economic reality appears to be quite different. The robust nature of the current US job market is proving to be one of the main drivers of the country’s strong economy.