

Search here
Can't find what you are looking for?
Feel free to get in touch with us for more information about our products and services.
Revving Up for E-commerce Success in Q4: Leverage Web Scraping

Inflationary pressures, rising prices, and the looming possibility of an impending recession have dealt an unwarranted blow to e-commerce sales over the last three quarters.
From the final quarter of 2009 to the second quarter of 2021, US e-commerce sales experienced steady growth for 46 consecutive quarters. However, in the quarters leading up to the 2023 finale, the growth of e-commerce sales has been lukewarm at best, especially when compared to the industry’s phenomenal performance in previous years.
As the holiday season approaches, the pressure intensifies on retailers to meet consumer demand. Q4 encompasses the holiday shopping season, featuring major events such as Black Friday and Cyber Monday.
This period holds immense significance for e-commerce giants like Amazon and Target, as consumers purchase gifts for Thanksgiving, Christmas, Hanukkah, and New Year’s. Traditionally, this time of the year contributes significantly to their annual revenue.
This year, online brands and retailers face a multifaceted competition, not only from their digital counterparts but also from physical stores. Consumers seek convenient and timely solutions for their holiday needs, compelling retailers to ensure supply chain efficiency and streamline operations.
As a data extraction company with a proven track record of collecting e-commerce data for brands to leverage it effectively, we embarked on a project centered around a few Amazon datasets. Over the last three months, we consistently scraped this dataset to explore whether a few randomized datasets, without crucial complementary data, could still provide valuable insights for E-commerce Q4.
Read on to discover our findings and gain deeper insights into the challenges and strategies shaping the e-commerce landscape this Q4.
Actionable E-Commerce Insights
If you’re looking to ingest e-commerce insights on the fly, here are the key takeaways from our Amazon data analysis:
- Boost your Inventory: High reviews for Gift Cards, Clothing, Shoes, and Jewelry point to skyrocketing sales. With the holiday season on the horizon, retailers, it’s time to stock up and soar!
- Amplify your strengths: Skechers lead Fashion Sneakers on Amazon with the highest Share of Search. For the holiday rush, leverage your strengths for maximum impact.
- Benchmark against the best: What are the first names that come to your mind when you hear diapers? Chances are it is Pampers and Huggies. Learn from Amazon: study your competitors, and understand the game.
- Apple Reigns Supreme: Apple Dominates Traditional Laptops with an unshakable first BSR position. Even in second place, Apple continues to command the majority – Unrivaled leadership in the digital realm.
- A chink in Apple’s armor: Between 23 July and 6 August, the ratings of one of Apple’s products dropped drastically, never reaching its pre-July levels. It could be the opening the barbarians at the gates are looking for.

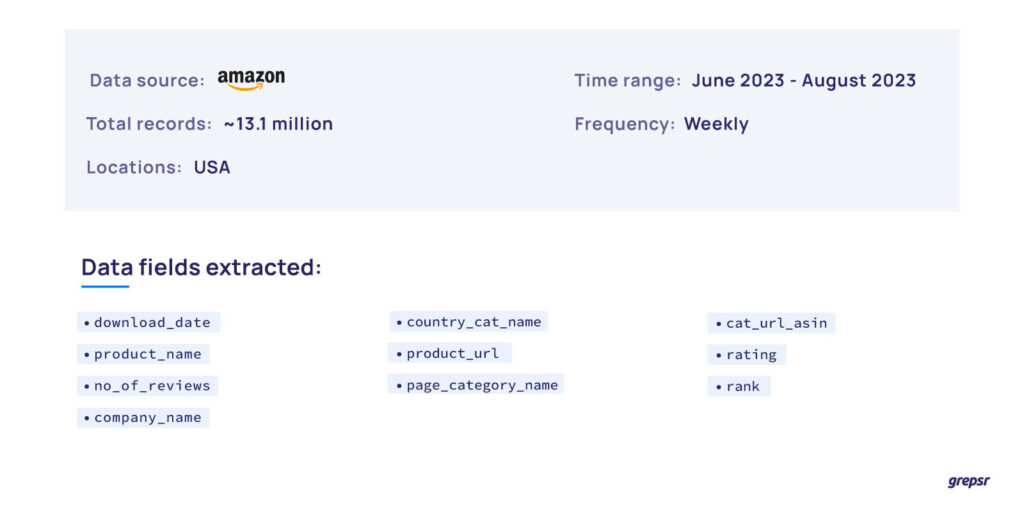
Amazon Dataset Overview
We collected the following data points from Amazon for a period of three months. To maintain a real-time relevance, we updated the data weekly. In total, the records reached approximately 13.1 million.
E-commerce Data Analysis
Disclaimer: The analyses presented here are based on a sample dataset from one of our data extraction projects, and do not reflect the entire market. This is only a hypothetical use-case of potential insights that could be gathered for better decision-making.
Boost your Inventory: High reviews for Gift Cards, Clothing, shoes & Jewelry point to Skyrocketing sales
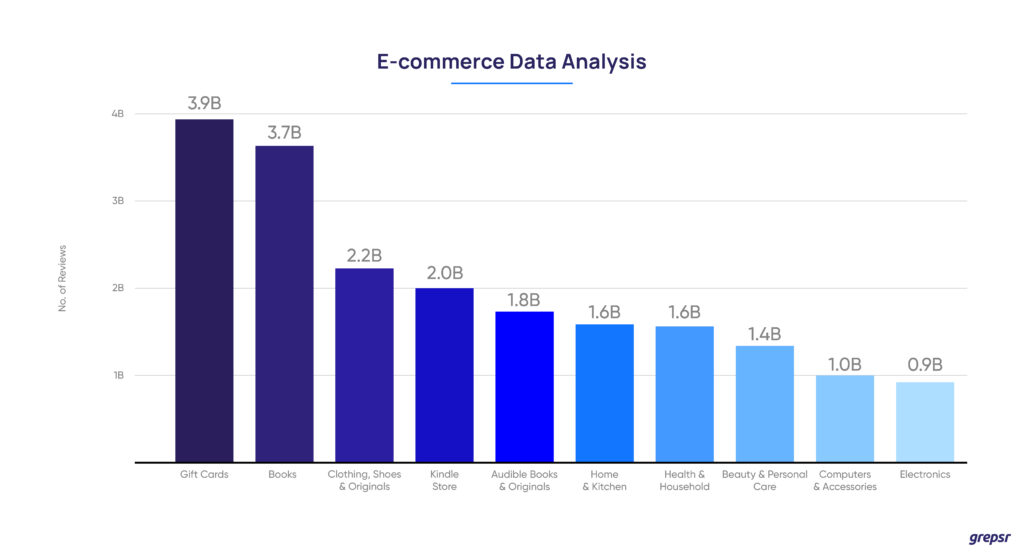
We examined the number of reviews across various product categories on Amazon. The products with the highest number of reviews included gift cards, books, clothing, shoes, and jewelry, among others.
The total number of reviews for gift cards has gone upwards of 3.5 billion, followed by books, clothing, shoes & jewelry, and so on.
In the months leading up to the final quarter, buyers have demonstrated significant engagement with these products.
This has two important implications: first, the sales of these products have consistently remained high over the last three months, and it appears these trends will continue into the holiday season as people purchase last-minute items to surprise their loved ones.
Amplify your strengths: For the holiday season, leverage your strengths for maximum impact
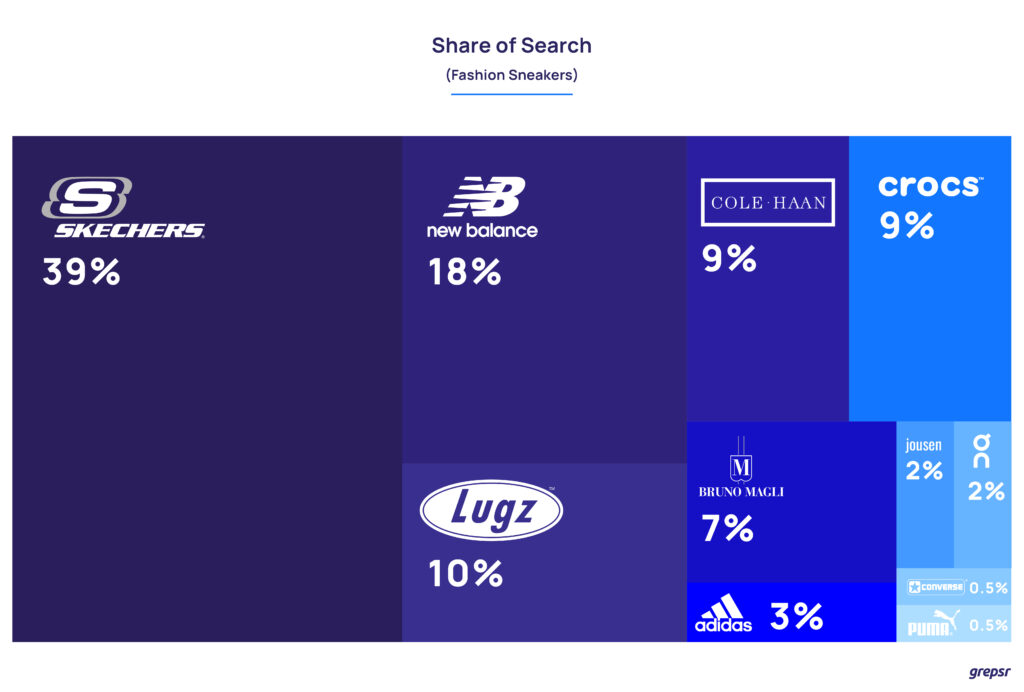
In the Fashion sneakers subcategory, Skechers have the highest Share of Search at 39%. New Balance is the closest competitor with an SOS of 18%. As you can see, other positions are taken up by a hotchpotch assortment of brands whose primary focus on sneakers is a combination of ‘form’ and ‘function’.
There is high anticipation in the market for the fast-approaching fire sales on Black Friday and Cyber Monday. If the historical data is to be believed, the sales of Sketchers should rise. To compete with Skechers on Q4 in terms of SOS, they might want to see what Skechers are doing right on Amazon.
First things first, we analyzed data present only in the ‘Fashion Sneakers’ category. Skechers are known primarily for being Fashion Sneakers but brands like New Balance are known to be ‘performance sneakers’. We haven’t analyzed New Balance, Adidas, and Puma’s data on their own turf.
At Grepsr, we have always maintained that data analysis is quite a creative endeavor. It’s about discovering patterns between disparate datasets and finding insights when seemingly there are none.
Nevertheless, one major insight to take away from this finding is that, it might do New Balance and Adidas good, to compete with Sketchers in a category where they have the upper hand.
Benchmark against the Best: Brand name does matter
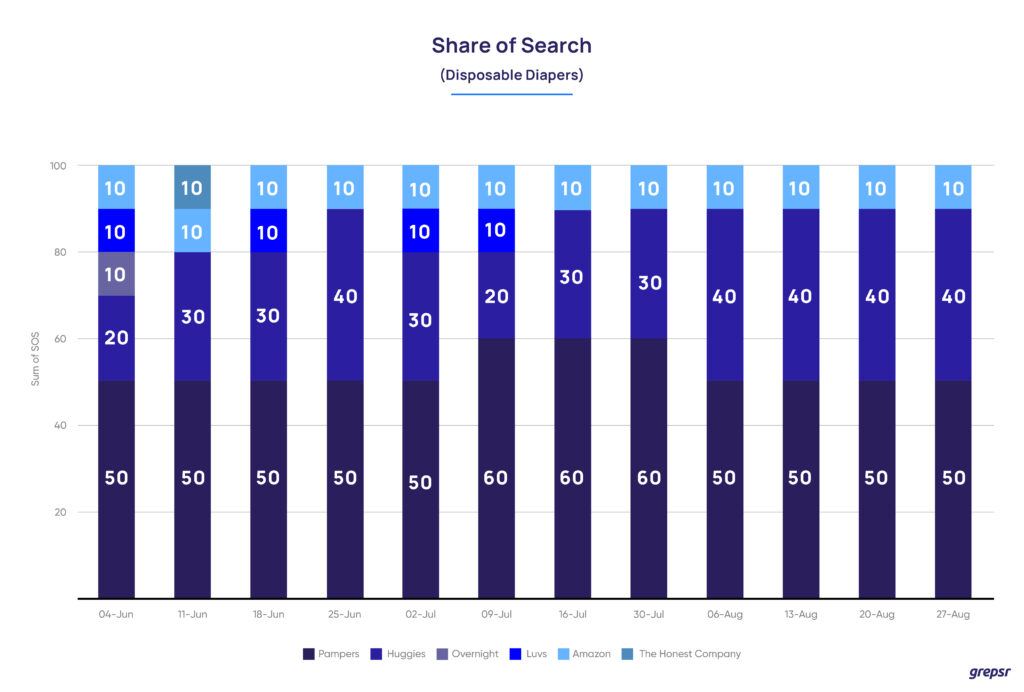
What are the first names that come to your mind when you think of diapers? Most likely, Pampers and Huggies. If that’s what you thought of, Amazon’s data supports your intuition.
In the past three months, anyone visiting Amazon and browsing the ‘Disposable Diapers’ subcategory would have encountered Pampers and Huggies more frequently than any other brand.
This analysis focused on the fluctuation in Share of Searches on a weekly basis, indicating how often diaper products appeared on the first Search Engine Results Page (SERP). Pamper consistently held the majority of the SERP, with a dominance ranging from 50% to 60%, while Huggies led between 20% and 40% of the time.
This clear trend underscores the significance of brand reputation. Pampers, founded in 1961, and Huggies, established in 1968, have long-standing reputations that precede them. However, this doesn’t mean other competitors are left with no option but to exit Amazon.
Amazon is a dynamic e-commerce platform, constantly refining its A9 algorithm to provide the best product suggestions based on consumer demands. While catching up might seem daunting, the first step towards success is benchmarking against the best.
Analyzing what your competitors are doing right – the categories they rank in, the content they post, the quality of their reviews, and more – is essential. By adapting to Amazon’s algorithm and understanding market trends, even newer or less established brands can carve out their space in the competitive landscape.
Apple’s legacy is a tough act to follow
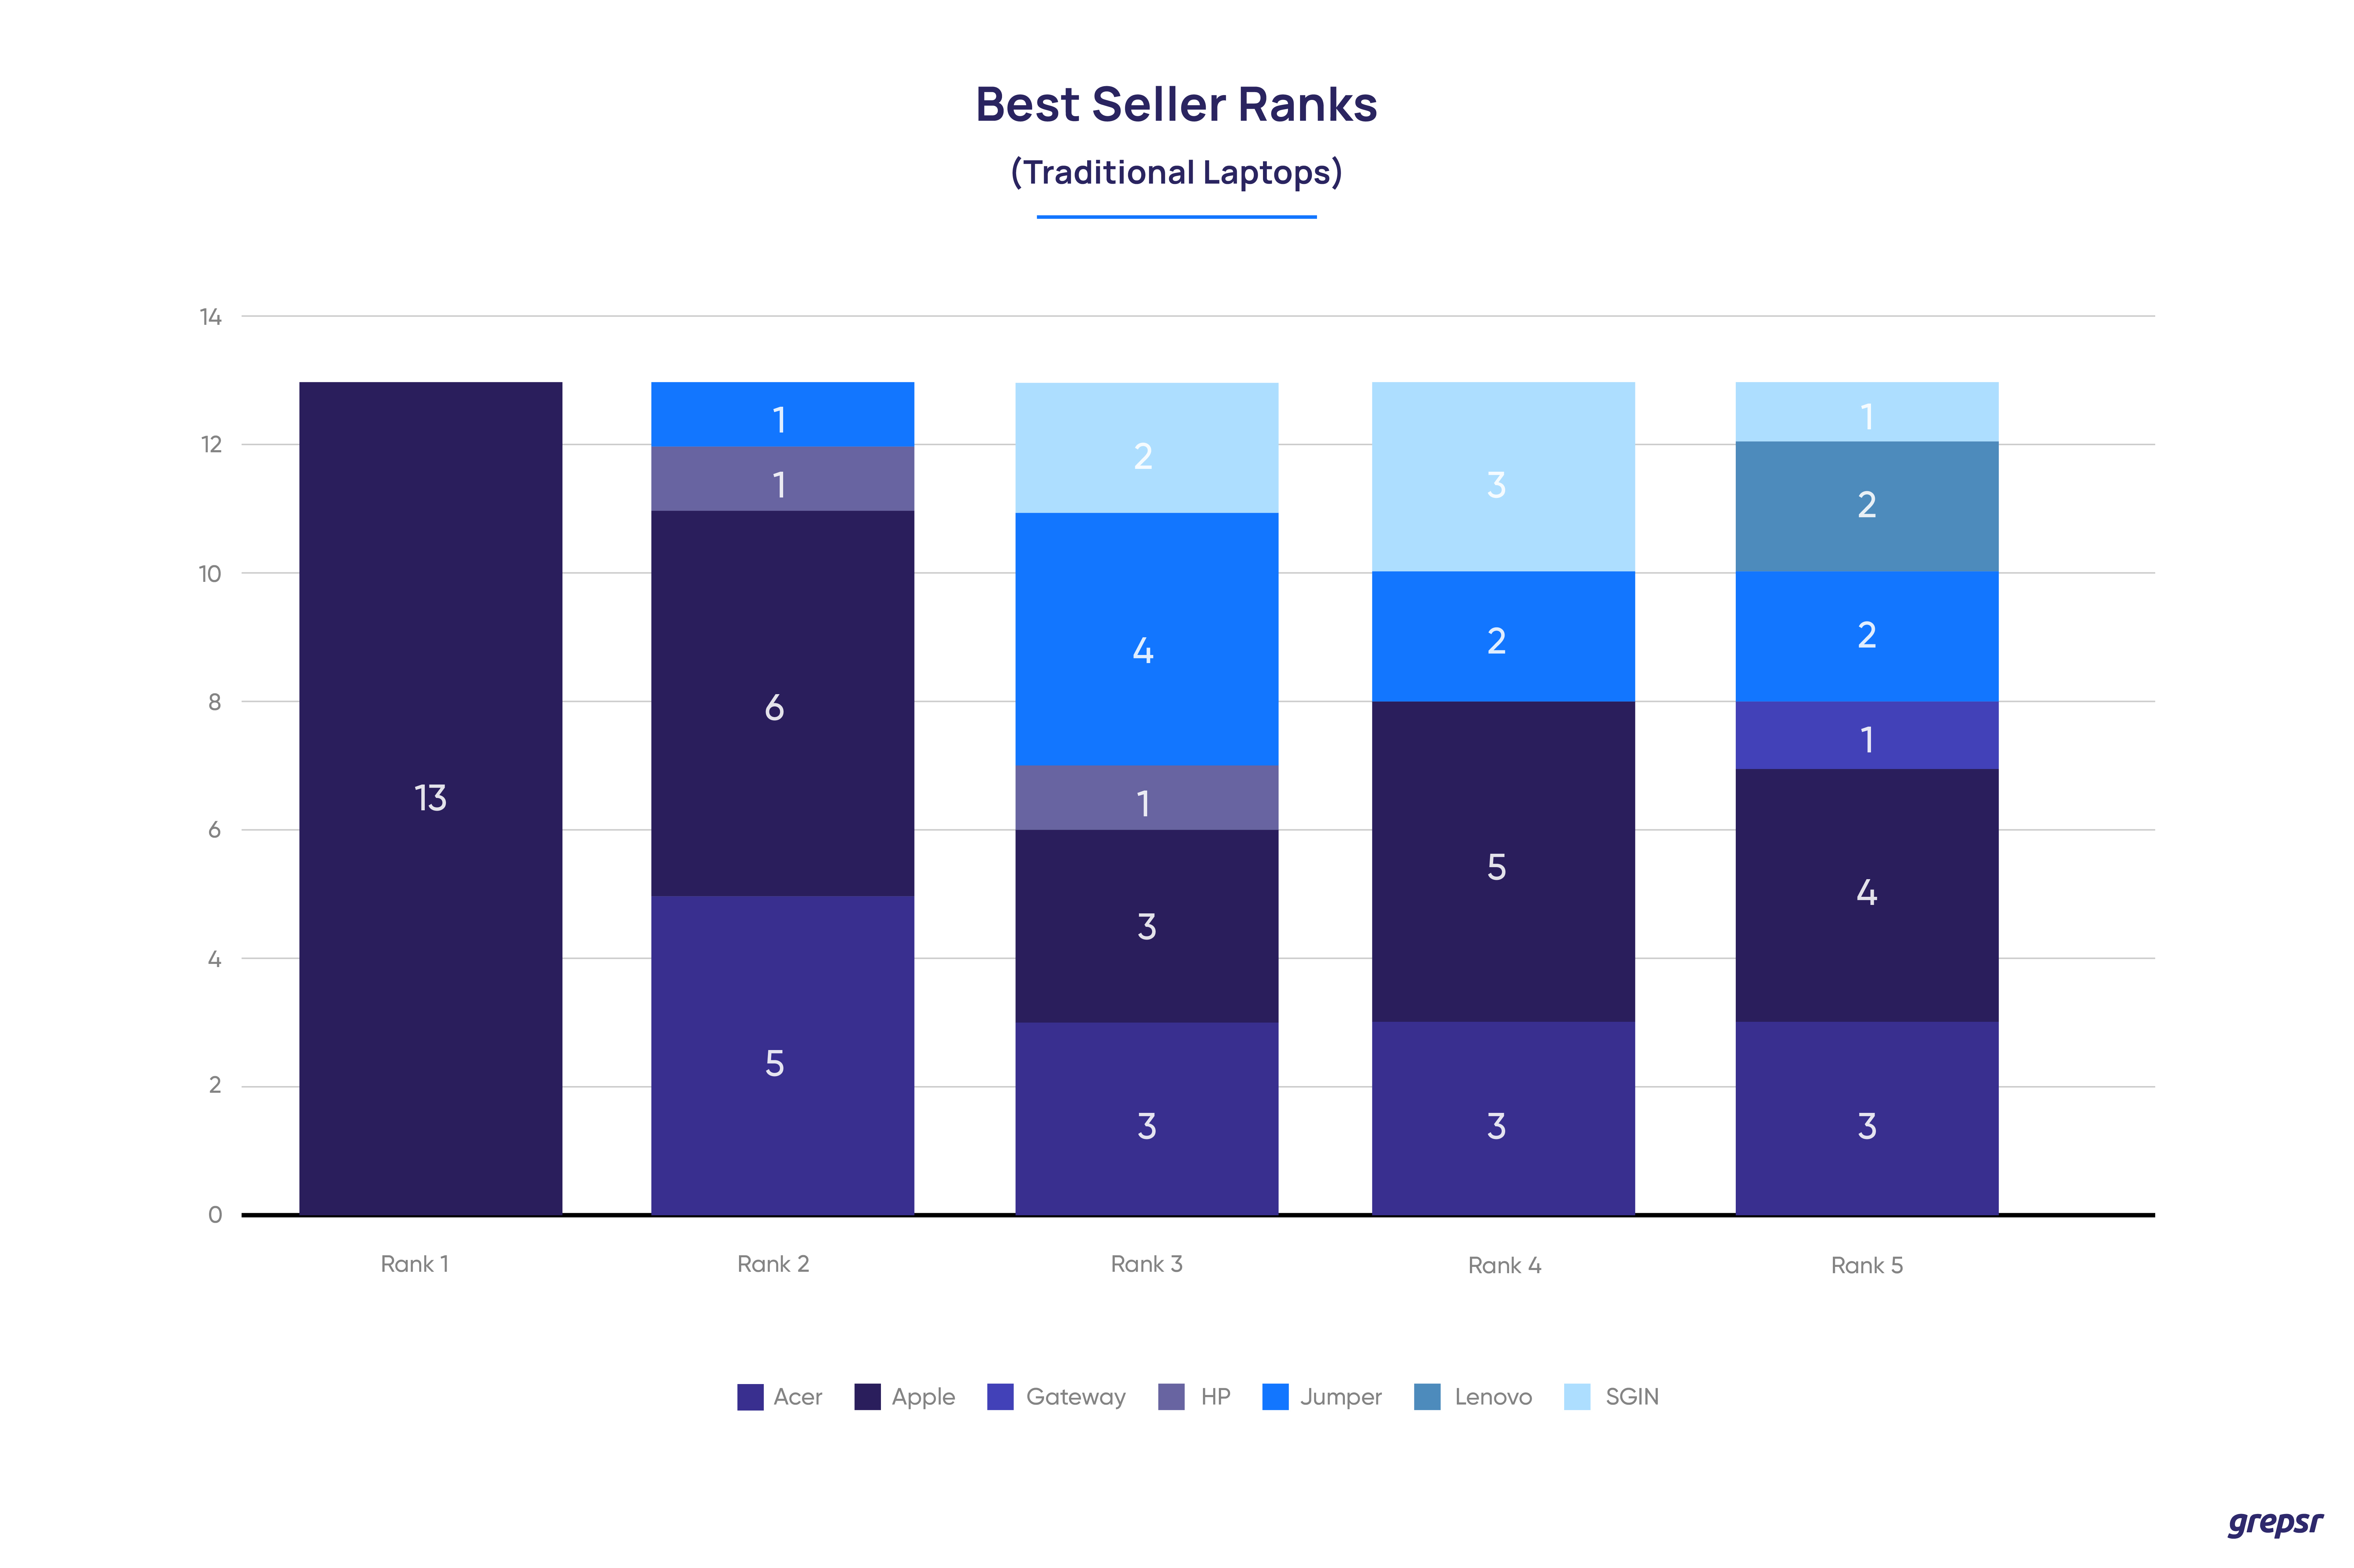
We looked at the Best Seller Ranks of different products in the Traditional Laptops subcategory, and found an insight not really that surprising.
In the entire duration of three months, not even once did Apple’s leading position at BSR number one change. Not an easy feat, when you consider that the BSR numbers on Amazon change on an hourly basis.
The BSR is a metric that shows how a product is selling on Amazon. As the name suggests, if you sell more products, you get the number one Best Selling Rank.
BSR is calculated by analyzing sales data over time. To add to that, recent sales data takes precedence over relatively older sales data. Meaning, you cannot rest on your laurels. The data clearly indicates that Apple is selling more products than any of its competitors and that the brand positioning of Apple still resonates very well with the consumers.
It is from the Best Selling Rank two that we see other brands raising their fists to compete. Acer won the Best Selling Rank two a total of 5 times, followed by Jumper and HP which won the second Best Seller Rank one time each. Even in the second best seller rank, Apple has won most of the time, six in total.
A chink in Apple’s armor?
Apple’s impressive performance in the Traditional Laptops subcategory raises a vital question: Is Apple truly infallible?
Now, don’t get us wrong. We are fervent Apple enthusiasts. Most of our developers are deeply rooted in the Apple ecosystem. However, we couldn’t help but wonder if it was even possible for a high-flying executive with a glint in his eye to pose a serious challenge to Apple’s dominance.
Our curiosity led us to analyze the average ratings of the top ten products in the ‘Cell Phones & Accessories’ subcategory, focusing exclusively on Apple products. Between July 23 and August 6, a significant event caught our attention.
The ratings of ‘Apple Earpods Headphones with Lightning Connectors’ drastically plummeted, never quite recovering their pre-July positions. The reasons behind this decline warrant a separate data analysis project, but it certainly caught our eye, and Amazon should have taken notice.
Could this be the opportunity that competitors have been waiting for, a chink in Apple’s armour? We leave that question to you.
Final words
Doing data analysis is like going down a rabbit hole of infinite patterns, paradoxical findings, and actionable insights. It takes a certain number of datasets and data analysis capabilities to distill the insights you are really after.
This data analysis exercise was only the result produced by a set number of datasets. To compliment these findings, and gain richer insights, one must delve deeper into the world of e-commerce data scraping.
As the holiday season kicks in, there’ll be brands who will dominate the market, and those who will fight for scraps. But, one thing remains as clear as daylight: Every e-comm player will up their game. It’ll be interesting to see what the aftermath will look like.
At Grepsr, we understand the need for real-time e-comm data at scale.
E-commerce is our major area of expertise and over a period of more than 10 years, we have developed a keen eye for data by working with the most influential brands in this space.
If you are interested in mining e-comm data to discover your areas of strengths, feel free to contact us. We are only a call away.
Shaping a prosperous future with data-driven decisions
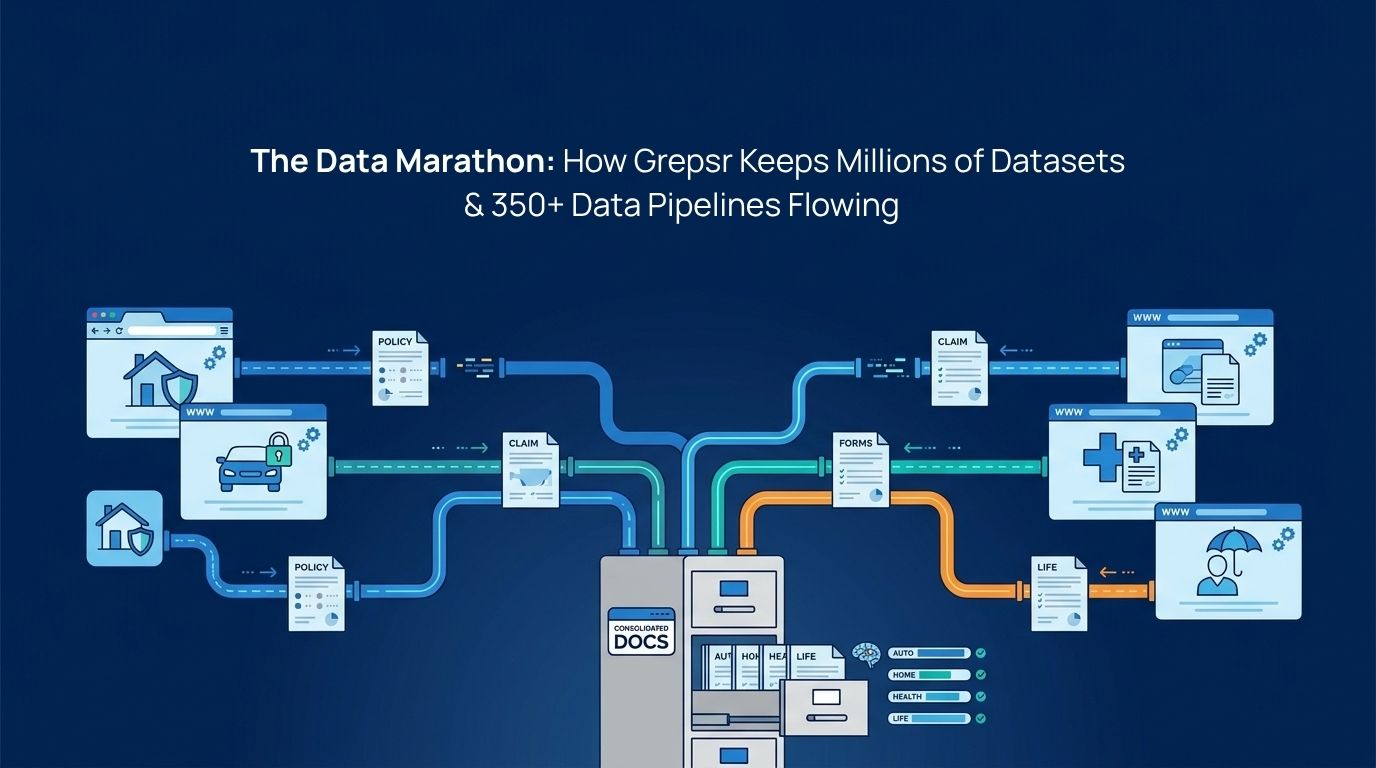
The Data Marathon: How Grepsr Keeps Millions of Health Insurance Records and 350+ Data Pipelines Flowing
A partnership story from the health insurance data industry When a New York-based health insurance data and API platform set out to build a standardised data layer for the employee benefits industry, the product vision was straightforward: Give brokers, benefits administrators, and health insurance carriers a single, standardised data layer including provider networks, plan details, […]
Web Scraping for Competitive Market Insights: Powering $3 Billion in EBITDA Through Data-Driven Pricing
Setting prices for products is similar to adjusting the sails on a boat. If you don’t read the wind properly, you’ll either be stuck in place or heading in the wrong direction. Data is the wind that helps you steer a steady course. In an economy where every dollar counts, businesses can’t afford to guess […]
Web Scraping for Drug Safety Monitoring: Real-Time Data Extraction for Tracking Side Effects
Quick Summary: Web scraping and public web data extraction can help pharmaceutical companies detect drug side effects faster by monitoring publicly available discussions and medical publications. This case study explains how a pharma company used web scraping to collect real-time signals about adverse drug reactions and turn scattered public information into structured safety data. Imagine […]

Analyzing Celebrity Impact on Consumer Behavior through Social Media Data: Taylor’s Version
This case study takes a deep dive into the powerful influence of global pop star –Taylor Swift. By extracting social media data using carefully selected keywords and hashtags, we analyze patterns and trends that reflect the powerful gravitational pull of her influence on consumers. Continue reading for jaw-dropping insights. The Power of Celebrity Influence Celebrities […]

Boosting Efficiency and Accuracy: The Power of AI Data Validation for E-commerce Growth
In e-commerce, one wrong product detail can cost you a sale, or worse, a customer’s trust. As businesses scale, ensuring the accuracy and consistency of their data becomes an increasingly complex challenge. Similarly, for a growing electronics retailer, managing an expanding catalog of products with manual data validation was a recipe for errors, delays, and […]
How Proactive Communication Scaled a Product Data Extraction Project for a Dental Supplier
The dental products retail industry is thriving in the online business sector. As more dental professionals turn to digital platforms for sourcing products, those who can harness the power of big data are gaining a competitive edge. One of the most effective ways to leverage this data is through product data extraction—the process of automatically […]
How a Leading Consumer Electronics Company Leveraged Automated Customer Review Extraction
Customer reviews serve as the backbone of product development and consumer insights. For one leading consumer electronics brand, these reviews were essential for fueling machine learning models that perform sentiment analysis and inform key business decisions. However, the frequent removal of reviews by platforms due to policy violations creates significant challenges, leaving gaps in the […]

Powering a Booking Intelligence System with Real-Time Hotel Data Extraction
In the travel industry, booking data is the pulse that reveals how markets move. It captures the patterns of demand, competition, and consumer intent like who’s booking, where, when, and at what price. This information fuels dynamic pricing, helps forecast occupancy, and enables travel platforms and hotels to anticipate market shifts rather than react to […]
How ESG Advisory Firms Can Leverage Automated Article Extraction for Smarter Insights
Government websites and official press releases are goldmines for ESG (Environmental, Social, Governance) intelligence. Every update – whether it’s a new regulation, policy amendment, or court directive can shape how ESG advisory firms advise their clients. Yet, these updates are scattered across hundreds of government portals, each with its own format, language, and publishing schedule. […]

Seamless Vehicle Data Extraction for a Leading Automotive Intelligence Provider
In the automotive industry, having access to comprehensive, real-time vehicle information is essential for making informed decisions. However, gathering this data from online sources comes with many challenges, such as security barriers, IP restrictions, and complex firewall configurations. These can significantly disrupt the flow of critical data needed to support key business operations. In this […]

High-Coverage POI Data Extraction For Powering FMCG Market Strategy
Finding the right retail locations is a lot like navigating a city without street signs – you might eventually reach your destination, but not without wasted time, missed turns, and lost opportunities. Points of Interest (POI) data acts as those street signs, offering clear visibility into where consumers shop, dine, and gather. For global brands […]
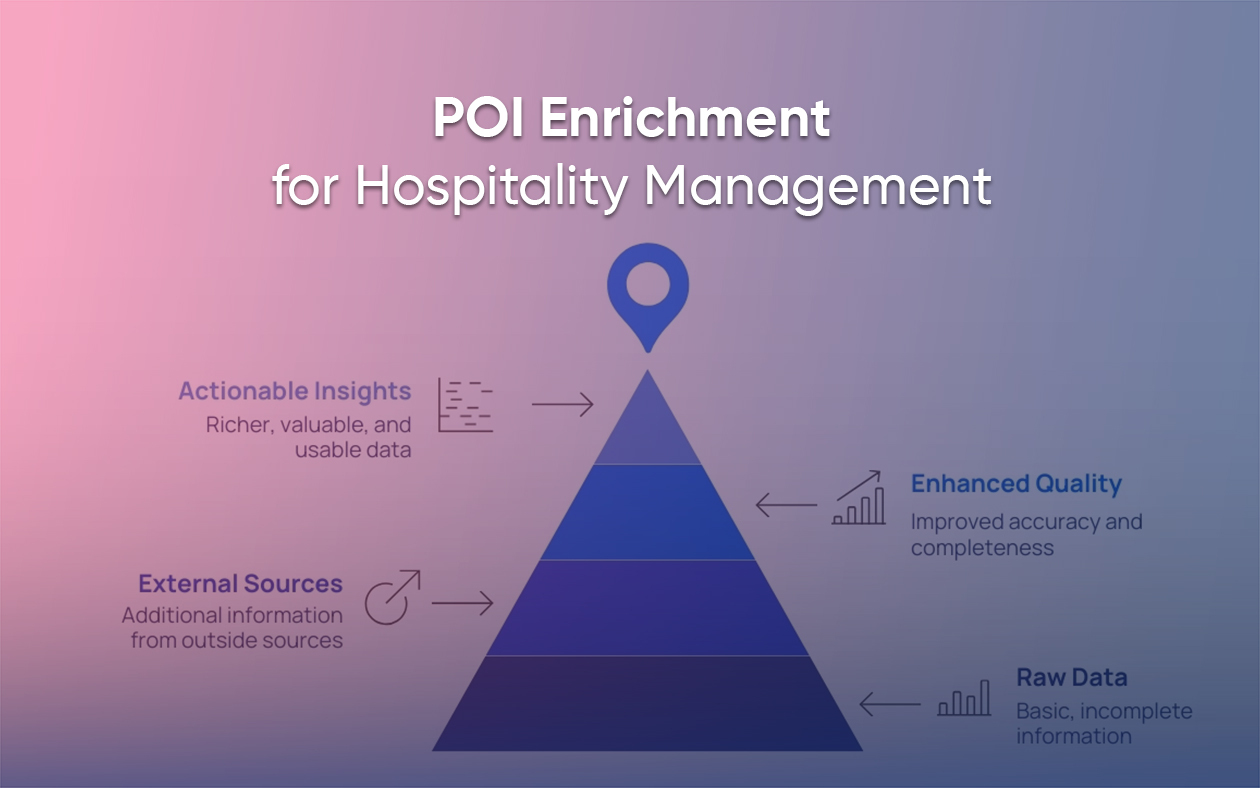
POI Data Enrichment for a Leading Hospitality Management Company
Data is valuable, but enriched data is priceless. Data enrichment is the process of adding value and further information to an existing dataset to improve its quality, accuracy, and completeness. It involves taking raw, incomplete data and enhancing it with additional and meaningful information from external sources. It turns a basic dataset into something richer, […]
Top Six E-commerce Datasets: Web Scraping Use Cases
The irreversible rise of e-commerce has been a similar phenomenon around the world. In 1998, the entirety of the e-commerce market stood at just $5 billion.
Location Intelligence in Retail: Real Use Cases From Grocery Stores
Do you know what separates successful retailers from the ones that are closing down? One key factor is using location intelligence in retail to make informed decisions. Modern retailers scrape the internet to find out competitor store hours, demographic shifts, and foot traffic patterns to find impactful location strategies. And the numbers back it up. […]
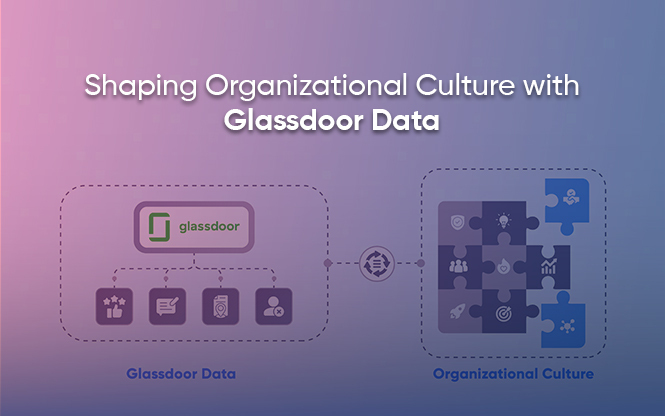
Shaping Organizational Culture with Glassdoor Data
Glassdoor Data offers a detailed look into organizational culture by analyzing employee reviews and ratings. This data provides insights into company dynamics, regional trends, and the impact of major events, helping businesses improve employee satisfaction and cultural alignment. Netflix’s culture deck, crafted by Reed Hastings, champions employee autonomy and creativity, even offering unlimited vacations as […]

How Web Scraping Saved a Vehicle Data Platform
How Grepsr rescued a vehicle data platform from a major OEM block—restoring 100% uptime, 99.9% data accuracy, and real-time API performance for VIN checks and insurance quotes.

Mapping LA Wildfire Impact with POI Data
POI data extraction and reverse geocoding transformed wildfire impact maps into precise addresses, enabling targeted disaster relief.
How a Real Estate Agency Gained Competitive Intelligence with Real-Time High-Quality Datasets
Gathering structured real estate data from various government sites and public records at scale poses significant challenges.
What Is Shipping Data & Why It’s Critical for Logistics Performance
Before the pandemic, the global supply chain relied on predictable inventory flows. There was high schedule reliability, which meant the carriers usually followed the same schedules. This ensured the arrival of inventory in time, replenishment of stores, and constant operation of the factories.

Unraveling Job Market Dynamics: Leveraging Data Analytics for Competitive Edge
The notion of hiring the “right” candidate needs clarification of what’s “right” for your organization. Starting from the alignment of values, motivation, ambition, and technical skills required for the position.

Enabling Market Expansion: Data Refinement at Grepsr
Any data is only as good as the insights derived from it. However, before we begin the analysis, the data must be put through adequate pre-processing techniques that standardize, aggregate, and categorize the dataset.

Introduction to Web Scraping & RPA
Web scraping automatically extracts structured data like prices, product details, or social media metrics from websites. Robotic Process Automation (RPA) focuses on automating routine and repetitive tasks like data entry, report generation, or file management.

Car Rental Data Unwrapped: Merry Miles and the Christmas Story in the UK
Delve into the festive drive as we analyze 50K+ car rental records from ‘Sixt – Rent a Car’ during December 2023. From the holiday surges on Christmas Eve to discovering budget-friendly gems like the Kia Picanto, come with us as we decode the Merry Miles of Christmas car rentals in the UK.

NYC POI Data Dynamics: Decoding Impermanence
Geographical locations or POIs are not entities that last for posterity. We collected NYC POI data to decode the various dynamics that may help executives make informed decisions within the backdrop of impermanence.

Harnessing POI Insights: The Web Scraping Advantage
Points of Interest (POIs) are more than just points on a map. They are filled to the brim with actionable data like addresses, names, contact details, and working hours. POI data also includes images, which add a visual component to the data. With web scraping, you can get the advantage you need to harness POI insights.
Analyzing US Job Postings Data to Understand Job Market & Economy
The US economy was forecast to spiral into a recession in 2023. Yet, despite fears, if current job listings and hiring trends are to be believed, the current economic reality appears to be quite different. The robust nature of the current US job market is proving to be one of the main drivers of the country’s strong economy.