This is one piece of a three-part series that looks at the various methods, techniques, and essential steps to ensure superior data analysis.
The majority of leaders from high-performing businesses attribute their success to data analytics. According to a survey done by McKinsey & Company, respondents from these companies are three times more likely to pin their accomplishments on data analytics.
That being said, although 1.145 trillion MB of data is created every day, stats show only 0.5% of it is analyzed to get results. This highlights a huge gap between companies that use data analytics to get ahead and those that don’t.
Grepsr has helped businesses bridge this gap, which in turn has given them an upper hand over their competitors. If you haven’t swiveled to data analytics yet, there is no better time to get started.


In the last post, we talked about the ‘why’ of data analysis, this time we will delve into the ‘how’.
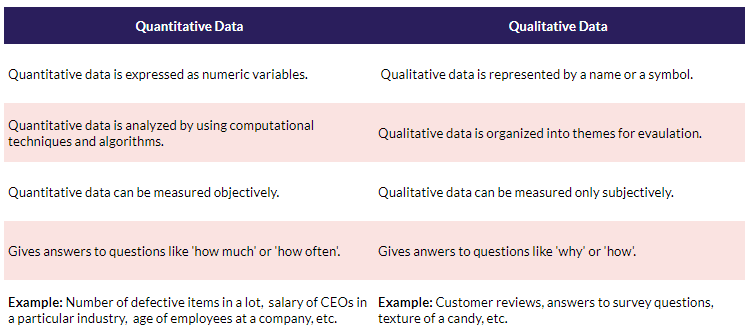
Qualitative and quantitative data
The internet has enabled us to create large volumes of data at a staggering pace. Moreover, the way you analyze it depends on the type of data you are working with. We broadly classify data into two forms — qualitative and quantitative.
Methods to data analysis
With so much data being created every day, it becomes imperative to go beyond the traditional methods to analyze this huge chunk of invaluable information.
Qualitative and quantitative data each have their own ways of being processed.
- Qualitative data analysis comes into play when the data you are trying to process has no bearing whatsoever with numbers, and cannot be tabulated — e.g. text, videos, images, etc.
- Quantitative data analysis deals with structured datasets that have numbers in them. It runs algorithms on statistical data to deduce objective truths.
Learn the key differences between qualitative and quantitative research from our recent blog.
Quantitative data analysis
Quantitative data analysis is a more traditional form of analysis. As mentioned earlier, this process crunches numbers to get results.
Since one of the major functions of this process is to run algorithms on statistical data to obtain the outcome, the methods used in quantitative data analytics range from basic calculations like mean, median, and mode to more advanced deductions such as correlations and regressions.
Some of the scopes of quantitative data analysis include:
- Project management
- Marketing
- Finance
- Research and Development
- Product planning
Qualitative data analysis
Qualitative data analysis is used when the data you are trying to process cannot be adjusted in rows and columns. It involves the identification, examination, and elucidation of themes and patterns in data (mostly textual) to bolster the decision-making process.
Unlike quantitative analysis, qualitative data analysis is subjective. This method of analysis allows us to move beyond the quantitative traits of data and explore new avenues to make informed decisions.
The following are some of the scopes of qualitative data analysis:
- Measuring customer satisfaction
- Monitoring competition
- Analyzing customer behavior
- Evaluating market trends
Learn more about qualitative data analysis in detail:

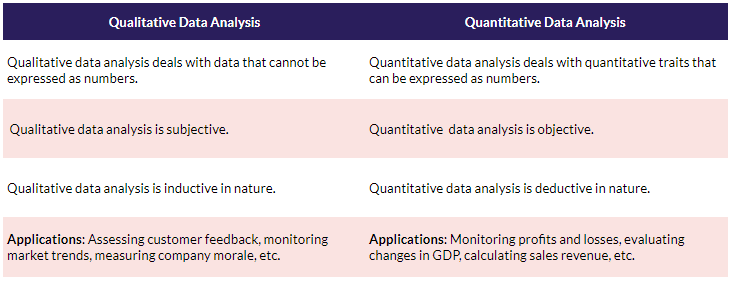
Differences between qualitative and quantitative data analysis
A veritable combination: qualitative and quantitative data analysis
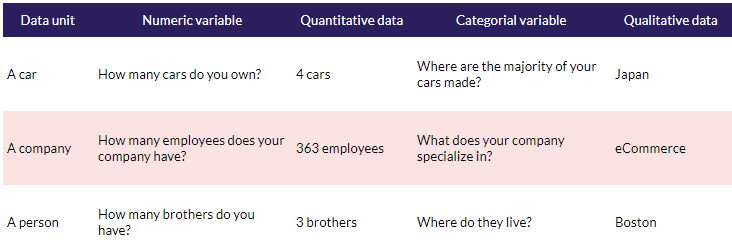
Quantitative and qualitative data analysis when used together can help you generate deeper insights. More often than not, quantitative and qualitative data can be collected from the same data unit as you can see below.
To gain richer insights you can even pair these two methods in different domains. Best use cases include Google analytics & user interviews, social media & community engagement, marketing & surveys, and so on.
Bear in mind that your way of analysis completely depends on your requirements. Sometimes, quantitative analysis will be more than enough, and other times, only qualitative will do just fine. When you want to dig deep into the data at hand, it is advisable that you go with both qualitative and quantitative data analysis.
If you want to learn more about the different techniques to perform qualitative and quantitative data analysis, click here. To add to that, if you ever need to analyze large amounts of data or need expert help, you can hire the top freelance data analysts to augment your development teams for data analysis.

How to Combine Qualitative and Quantitative Analysis
Mixed-methods approaches deliver richer insights than either technique alone. Quantitative data reveals what is happening, while qualitative data explains why it happens.
Effective Mixed-Methods Combinations
Web analytics + user interviews: Google Analytics shows 65% of users abandon checkout on the payment page (quantitative). User interviews reveal they leave because shipping costs appear unexpectedly at the final step (qualitative).
Sales data + customer feedback: Revenue reports show a 22% drop in repeat purchases (quantitative). Customer reviews mention recent product quality issues (qualitative), connecting the revenue decline to a specific operational problem.
Social media metrics + sentiment analysis: Engagement rate increased 40% after a campaign launch (quantitative). Comment analysis reveals the increase came primarily from negative sentiment about a controversial ad creative (qualitative), indicating high engagement doesn’t always mean positive reception.
A/B test results + session recordings: Version B increased conversions by 18% (quantitative). Session recordings show users on Version A got confused by unclear CTA button placement (qualitative), explaining the performance gap.
Survey ratings + open-ended responses: NPS score is 42 (quantitative). Text analysis of the “Why did you give this score?” responses reveals customers love the product but hate the billing process (qualitative), directing improvement efforts to a specific area.
About Grepsr
Grepsr understands that your business has very specific needs when it comes to data. Be it data in the form of hard numbers or just images, we specialize in extracting data from far-flung areas of the internet.

Let us know about the data you need for effective analysis, and we will get back to you in a jiffy!
FAQs
Can you use qualitative and quantitative methods together?
Yes, combining both methods often provides deeper insights. Use quantitative analysis to identify what is happening and measure its magnitude, then apply qualitative methods to understand why it’s happening and what it means in context.
Which data analysis method is more accurate?
Neither is inherently more accurate – they measure different things. Quantitative analysis provides precise numerical measurements with statistical confidence levels. Qualitative analysis offers interpretive accuracy about meanings, motivations, and context. Accuracy depends on using the appropriate method for your research question.
How do you choose between qualitative and quantitative analysis?
Choose based on your research question. Select quantitative methods when you need to measure, count, or statistically test relationships. Choose qualitative methods when you need to understand context, explore new phenomena, or interpret subjective experiences. Use both when you need comprehensive understanding.
What tools are used for quantitative data analysis?
Common quantitative tools include Microsoft Excel, Google Sheets, R, Python (pandas, NumPy, SciPy), SPSS, SAS, Tableau, Power BI, and specialized statistical software. The choice depends on dataset size, complexity, and required analytical techniques.
What tools are used for qualitative data analysis?
Qualitative analysis tools include NVivo, MAXQDA, Atlas.ti, Dedoose for manual coding, and NLP platforms like MonkeyLearn, Lexalytics, or custom Python solutions (NLTK, spaCy) for automated text analysis. Many analysts also use spreadsheets for basic thematic categorization.
How long does data analysis take?
Timeline varies dramatically based on data volume, complexity, and method. Simple quantitative analysis might take hours, while comprehensive mixed-methods research can require weeks or months. Data preparation typically consumes 50-80% of total project time regardless of method. Grepsr can expedite this process by collecting data from the web at scale.