Data is ubiquitous and plays a vital role in helping us understand the world we live in. Quantitative data, in particular, helps us make sense of our daily experiences.

Whether it’s the time we wake up in the morning to get to work, the distance we travel to get back home, the speed of our car while commuting, our annual income, our credit score, or any other instance where numbers are involved, data is present all around us.
Likewise, our business also leans on quantitative data for measuring significant objectives of our KPIs. It involves monitoring the net profit margins, the traffic we get on our website, leads conversion rate, user engagement rate, bounce rate, etc.
By analyzing the data gathered by businesses, it helps them formulate data-driven strategies.
This approach leads to informed decision-making for company expansion and development.
Since we have already discussed qualitative data analysis in our previous blog, so this blog will be centered around the notion of quantitative data.
We will help you comprehend what kinds of data are known as quantitative data, and how you can collect it for research and eventually perform statistical analysis for actionable insights.
Quantitative Data Definition
In simple terms, data that is expressed in numeric terms and can be counted, scored, and measured is quantitative data.
It is measured objectively as it is based on facts and it is frequently used in algorithms, mathematical calculations, and statistical analysis.
Quantitative data is unbiased because of its numerical nature, unlike qualitative data which is subjective and can contain personal biases of individuals.
It generally answers the kind of questions that have a fixed answer such as “how often”, “how much”, “how many”, and “what percentage”.
For example, it can give you the number of users who visit your site per month. However, it cannot give you a reason as to why they were browsing the site.
You are on your own to draw conclusions, make comparisons, and identify patterns from quantitative data with the help of analytics tools/software.
Types
It can be broadly classified into two categories.
Discrete
Data that consists of distinct, specific, and separate values is known as discrete data.
The values of discrete data cannot be segregated into smaller units and are often counted in whole numbers.
Having said that, it doesn’t necessarily mean that it most definitely has to be represented by whole numbers, under certain conditions it can also take fractional values.
You can identify discrete quantitative data quite effortlessly by questioning whether you can count it or not.
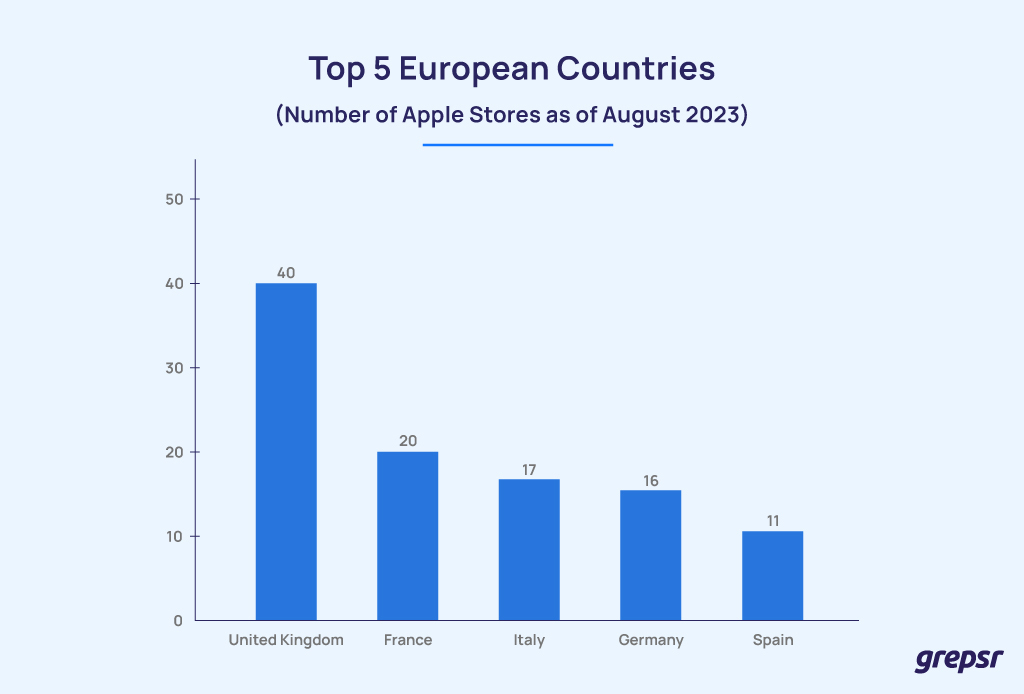
For instance, the number of members in a baseball team, the number of multiple choice questions in an exam paper, the monthly revenue of a business, and more.
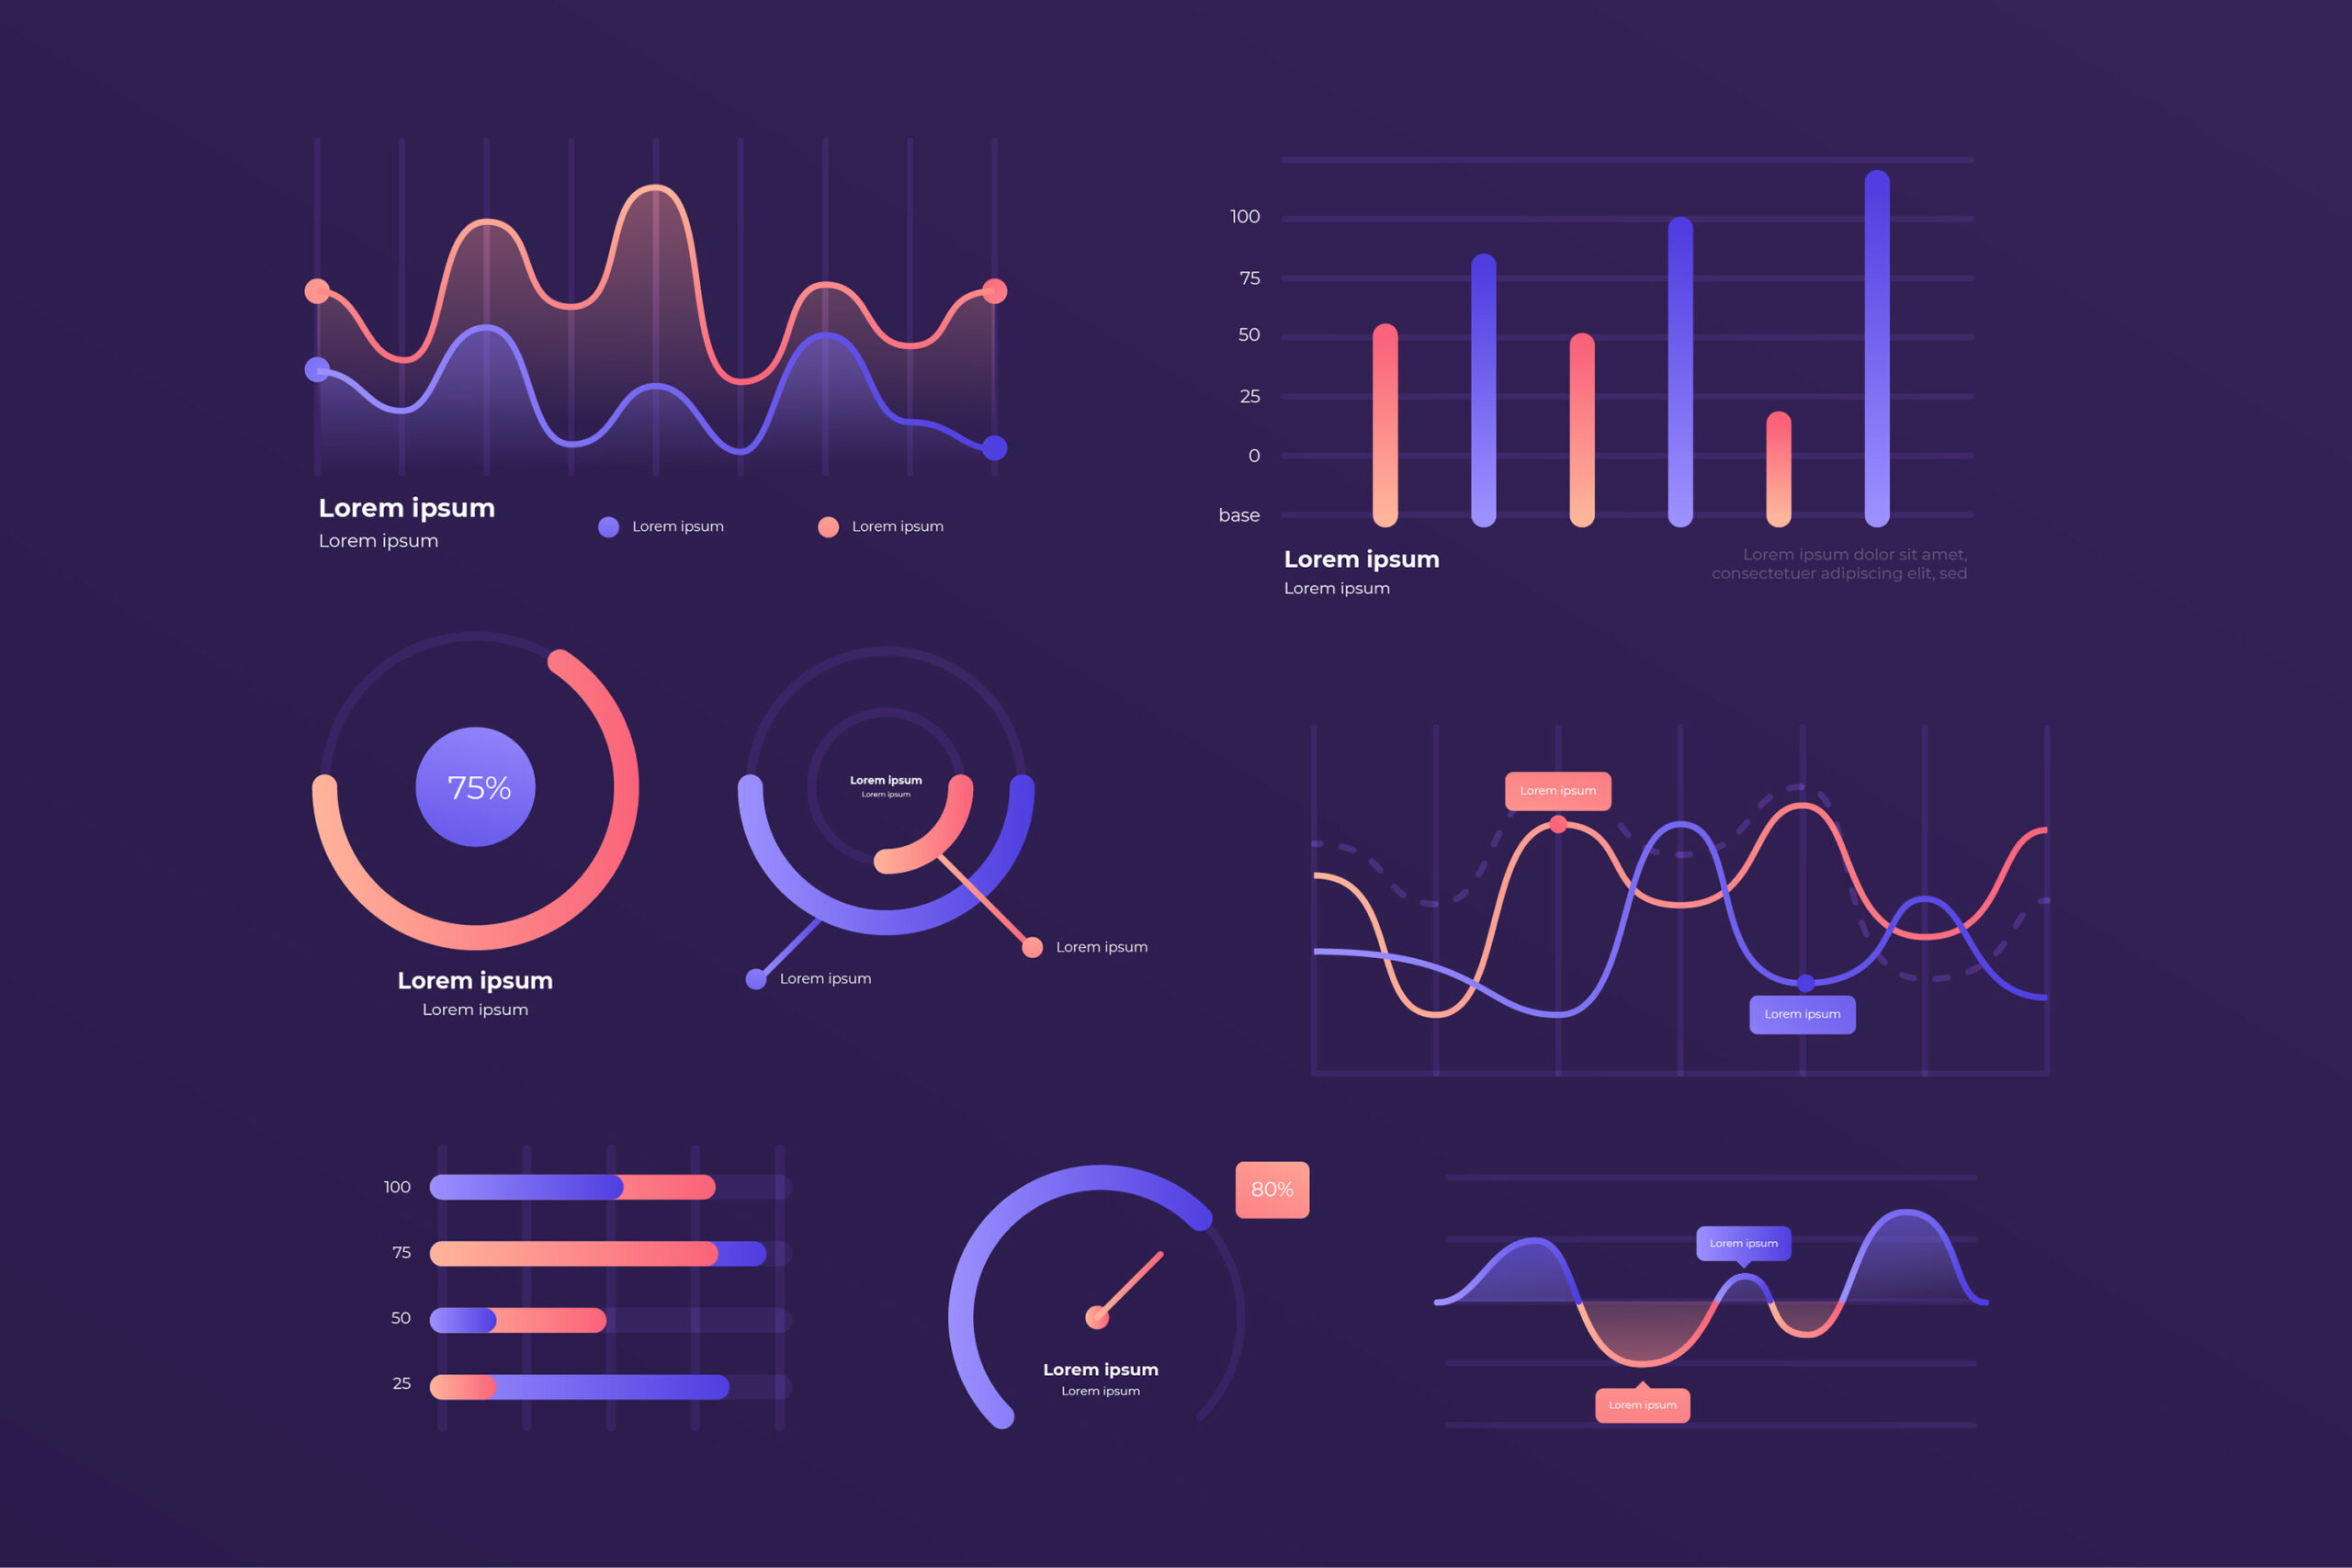
They are also known as attribute data. It can be illustrated using a tally chart, pie chart, or bar graph.
Continuous
On the contrary, continuous data is the type of data that can take any value within a given range. It tends to vary and fluctuate over time.
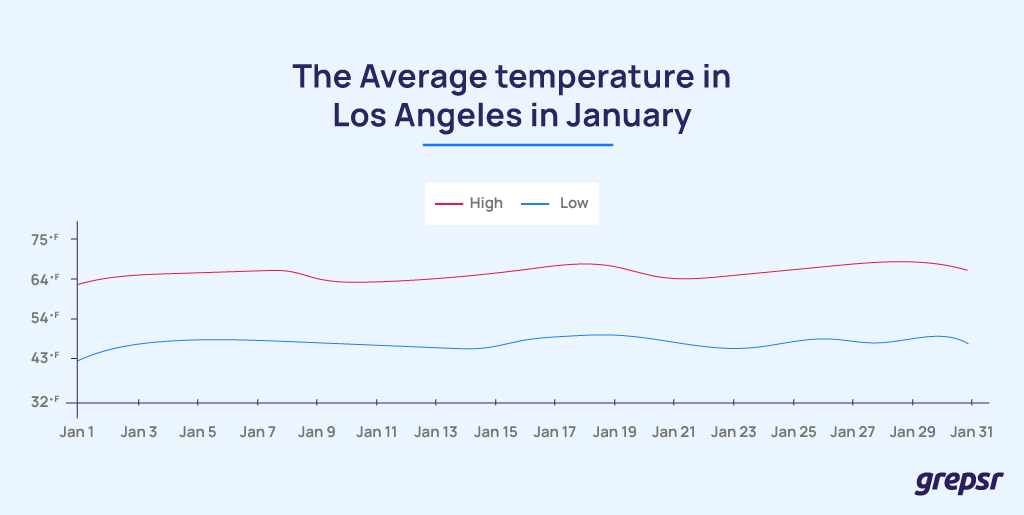
It can even be infinitely and at the same time, meaningfully be broken down into smaller parts. The temperature of New York City during the winter season, the traffic of a website, and the height of a child are some examples of continuous data that change over a certain period.
A line graph represents it as it shows the swings in values that transpire within the timeline.
It is further divided into subcategories: interval and ratio data. The former can go below the value of zero such as temperature but for the latter one, the value starts from zero, such as weight.
Ways to Collect Quantitative Data
Typically, researchers collect quantitative data to gain quick answers from a large sample size.
Close-ended Surveys:
Surveys are the most popular forms of data collection, both qualitative and quantitative.
For quantitative data collection, the surveys are short, concise, and to the point.
You must have come across this method of collecting surveys quite often in your life. From telling YouTube that you like their content via 1-5 ratings, to clicking one of the two options in the poll sticker from an Instagram story.
Similarly, you can conduct close-ended surveys via email to targeted leads, generate QR codes in magazines, and newspapers for the general public, use social media to circulate the Google form, and collect quantitative data in the fastest way possible.
Web Scraping: Industry-wise
On the other hand, although it might seem unlikely, web scraping can be another way to gather quantitative data.
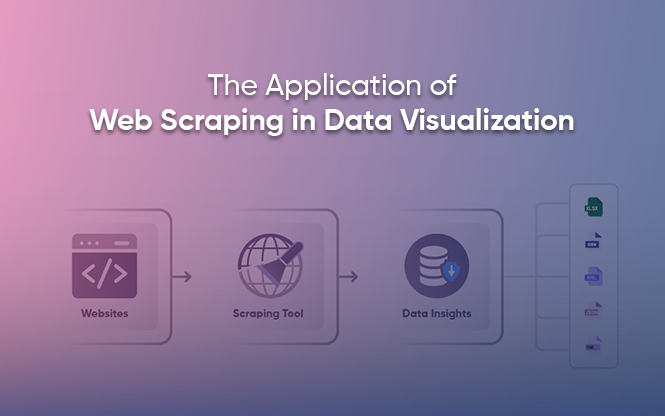
The process of extracting data from targetted sites and their individual web pages using automated tools or code scripts is called web scraping.
Initially, you can determine the website that contains quantitative data such as numeric values and statistics. Next, you need to understand the website structure and then employ a web scraping tool or libraries of your preferred programming language (like Python, or JavaScript) to access the web page and start extracting the data.
Here’s a practical example.
Consider yourself a researcher who is looking for data on population statistics from different countries. For this, you can extract data from The World Bank as it is the most reliable source to base your research on.
From the platform, you can gain a wide range of global economic and development data such as GDP rate, GDP per capita, poverty rate, and unemployment rate, etc.
Thus, by web scraping, you can extract qualitative data from external sources in the fastest way possible thanks to automation.
However, extracting data from websites can be problematic due to various anti-bot security measures. Like CAPTCHAS, dynamic content, and IP blocking, which tools may not be able to bypass.
In such cases, seek assistance from an external data provider like Grepsr. With 12 years of experience, we offer reliable web scraping services that assist in collecting accurate and high-quality data.

Quantitative Data Analysis
Technically, quantitative data analysis is the process of analyzing and interpreting quantitative data.
It is commonly referred to in various scientific disciplines for its rigorous and structured approach to studying, interpreting, and making sense of raw numeric data. It helps you to identify trends, and, patterns between variables via mathematical and statistical tests.
Further, discovering and understanding quantifiable relationships between variables is as easy as pie using quantitative data analysis. It often employs standard procedures to ensure consistency as it aims for objectivity and reliability.
Now we are capable of converting individual data points in a spreadsheet into meaningful insights with the help of data analysis.
If you’re drowning in the pile of a voluminous spreadsheet with thousands of rows and columns containing the preferences and sales information of customers but don’t know what to do with it, here comes analysis to the rescue.
For example, you can determine the average number of buyers who prefer one product over the other, and identify the most sought-after products. Similarly, you can find out which products are overstock, and identify the times when shoppers are most active.
Therefore, you can communicate the scrambled dataset of your quantitative findings effectively via charts, and, graphs utilizing data visualization.
Methods of Analysis
- Cross-Tabulation
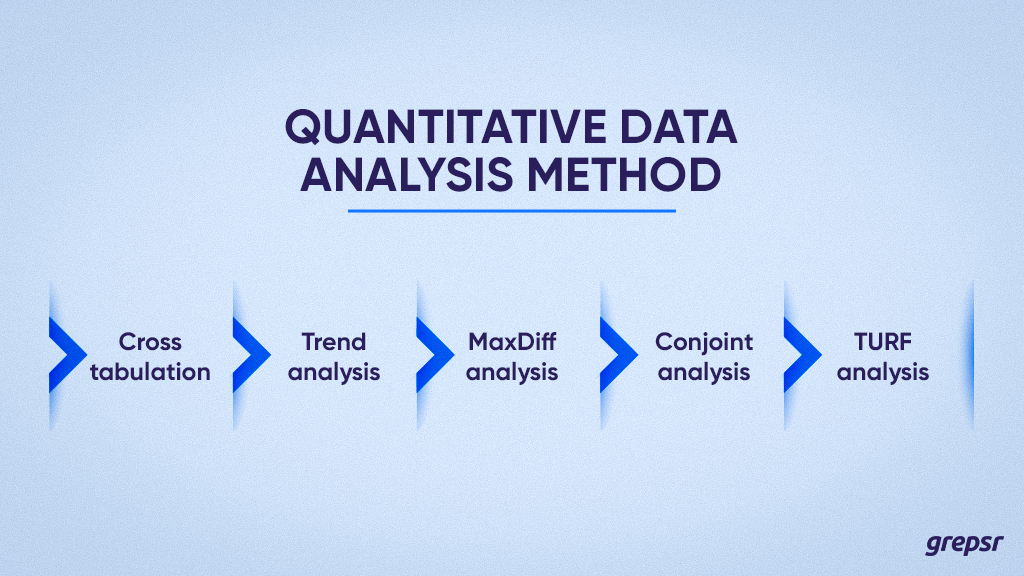
This method uses a simple tabular structure to draw conclusions from the acquired data. It entails gathering a variety of factors and determining their correlation. This strategy, often known as contingency tables or cross tabs, is suitable for retrieving essential details from huge data sets.
- Trend analysis
Trend analysis is a statistical analysis technique that allows you to look at quantitative data collected over an extensive amount of time. This form of data analysis collects input on how data varies over time. It seeks to comprehend the change in variables while one remains constant.
- MaxDiff analysis
MaxDiff analysis, commonly known as the ‘best-worst’ method, seeks to determine respondents’ preferences. So, whether you wish to figure out which transaction was more satisfying for the buyer or which parameters the customer ranks higher, this method is ideal to use.
- Conjoint analysis
As similar to the MaxDiff analysis, conjoint analysis is the method for analyzing the factors that influence purchase decisions. This method is capable of collecting and analyzing complex data that provide detailed insight into purchase decisions. Also, you can gain an in-depth understanding of the parameters that rank as the most important.
- TURF analysis
TURF is short for Total Unduplicated Reach and Frequency Analysis, individuals use it to fine-tune a company’s market strategy. It entails examining which platform has the most reach so that you can tweak the efforts of your team in the proper direction.
The Bottom Line
In conclusion, as we delve into the realm of quantitative data, we unveil its omnipresence and pivotal role in unraveling the intricacies of our experiences and business landscapes.
From defining its types to exploring efficient collection methods and analysis techniques, this blog guides you in understanding how we can crunch raw numbers and transform them into actionable insights.
In the end, we want your business to have the most accurate, reliable, and quality data at scale. This will create a strong foundation for well-planned business strategies.
Hence, keep your web scraping woes at arm’s length and play your cards right by collaborating with Grepsr. Propel your business toward industry superiority through data-driven informed decisions.


