So you’ve set up your online shop with your vendors’ data obtained via Grepsr’s extension, and you’re receiving their inventory listings as a CSV file regularly. Now you need to periodically monitor the data for changes on the vendors’ side — new additions, removals, price changes, etc.
While your website automatically updates all this information when you import from the CSV file, you might sometimes want to see for yourself or display to your customers what changes your vendors have made to their stock.
Let’s take the same example of Teva as in the previous blog, and see how you can easily compare the old and new data sets, and track the changes.
Using this tutorial (Thanks, Chris Moffitt, for the awesome post!) as a guide and making a few modifications, you can set up a project to work with CSV files instead of Excel spreadsheets.
For this blog, I’m assuming you have Python and Pandas packages installed on your system and you’re familiar with at least the basics of programming. Now, you can easily follow along and customize the code to suit your situation.

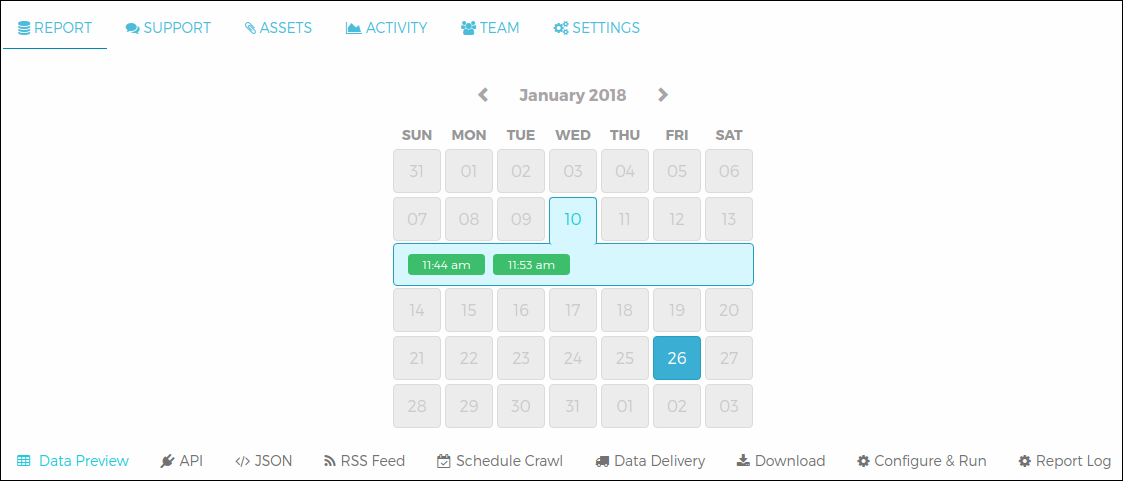
Before we start, let’s get our files ready. If you haven’t already, head over to the project on your Grepsr app dashboard and browse through the calendar to see when your crawler was run. When you click on the highlighted dates, you’ll see the time of the crawl on that day, after which you can go to the Download tab below the calendar to download your data for that particular crawl.
If you want the latest data, simply re-run your crawler by going to the Configure & Run tab, and download the file once the web scraping is complete.
All set? Let’s get started!
Step-1: Make life easier by structuring the files
Our first course of action will be to figure out how we can filter unwanted content and create easily manageable files using Python and Pandas.
Our old and new datasets are tevasale_jan10.csv and tevasale_jan26.csv respectively. Here’s a simple code to structure the files:
import pandas as pd

# Reading content from the CSV files
old = pd.read_csv('Teva_files/tevasale_jan10.csv')
new = pd.read_csv('Teva_files/tevasale_jan26.csv')

# Replacing newlines in the Colors and Sizes columns with " | " as separator
old['Colors'] = old['Colors'].str.replace('n+', ' | ')
new['Colors'] = new['Colors'].str.replace('n+', ' | ')
old['Sizes'] = old['Sizes'].str.replace('n+', ' | ')
new['Sizes'] = new['Sizes'].str.replace('n+', ' | ')

# Removing "Model: " prefix in the Model column
old['Model'] = old['Model'].str.replace('Model: ', '')
new['Model'] = new['Model'].str.replace('Model: ', '')

# Replacing newlines and white-spaces in the Name column with " | " separating the category and name
old['Name'] = old['Name'].str.replace(''s(ns+)', ''s | ')
new['Name'] = new['Name'].str.replace(''s(ns+)', ''s | ')

# Removing empty rows using the Name column as reference
old = old.dropna(subset=['Name']).reset_index(drop=True)
new = new.dropna(subset=['Name']).reset_index(drop=True)

# Writing the structured data to new CSV files
old.to_csv('Teva_files/tevasale_old.csv', index=False)
new.to_csv('Teva_files/tevasale_new.csv', index=False)
Let’s see what our structured file looks like.
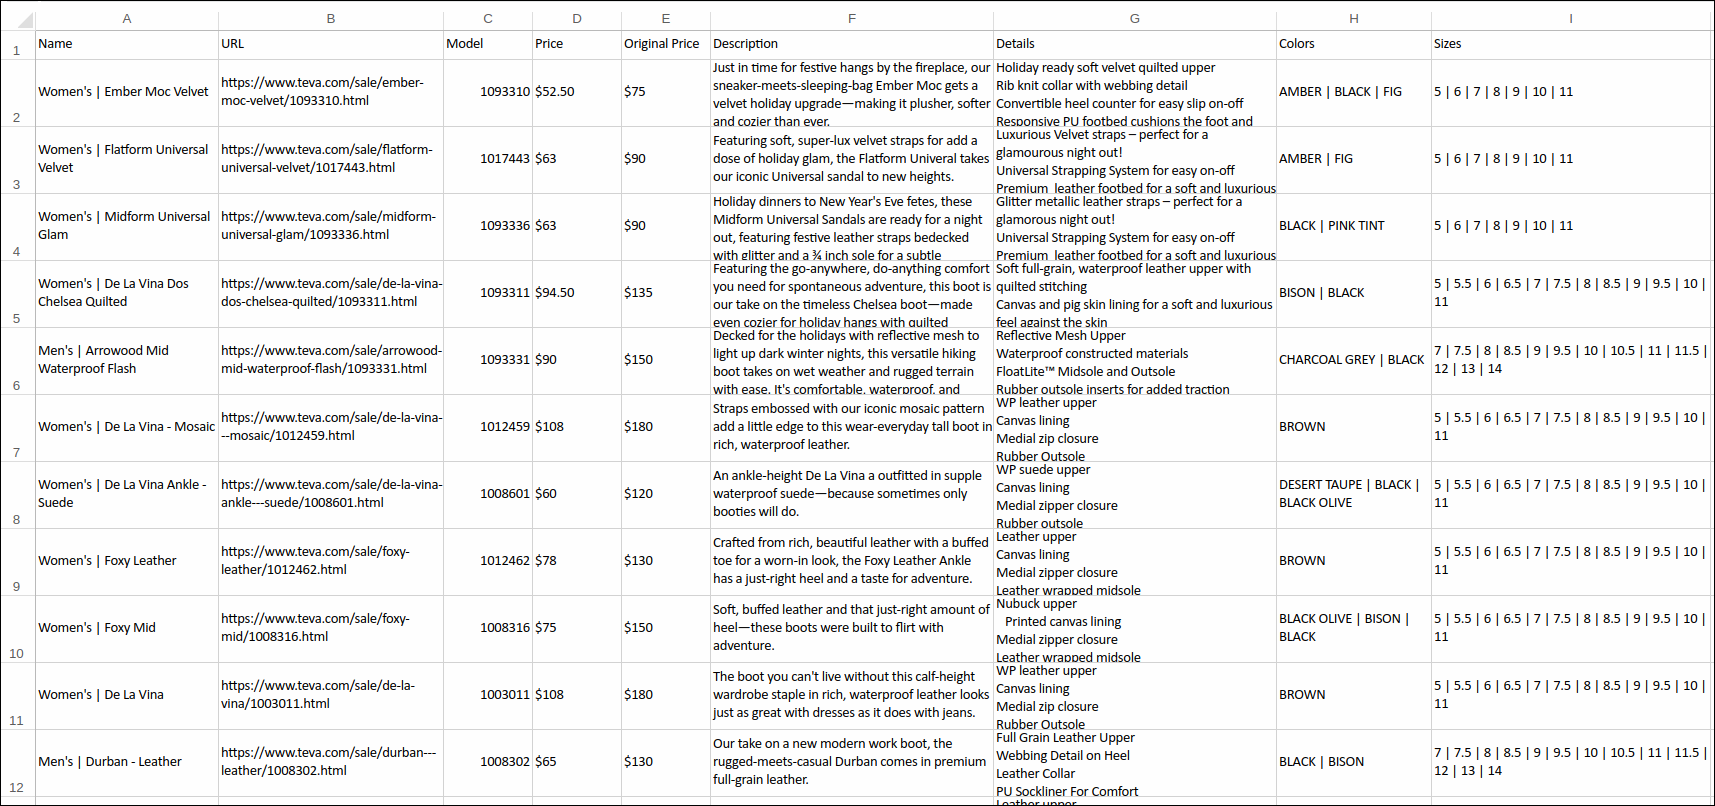
tevasale_old.csv
Step-2: Find changes in your data and save to a new file
Now that we’ve refined our data, we can proceed with Python to compare two files.
The code for comparing our two CSV files tevasale_old.csv and tevasale_new.csv, and exporting the changes to another CSV file tevasale_changes.csv is as follows:
import pandas as pd

file1 = 'Teva_files/tevasale_old.csv'
file2 = 'Teva_files/tevasale_new.csv'
file3 = 'Teva_files/tevasale_changes.csv'

cols_to_show = ['Model', 'Price', 'Original Price', 'Colors', 'Sizes']

old = pd.read_csv(file1)
new = pd.read_csv(file2)


def report_diff(x):
    return x[0] if x[1] == x[0] else '{0} --> {1}'.format(*x)


old['version'] = 'old'
new['version'] = 'new'

full_set = pd.concat([old, new], ignore_index=True)

changes = full_set.drop_duplicates(subset=cols_to_show, keep='last')

dupe_names = changes.set_index('Name').index.get_duplicates()

dupes = changes[changes['Name'].isin(dupe_names)]

change_new = dupes[(dupes['version'] == 'new')]
change_old = dupes[(dupes['version'] == 'old')]

change_new = change_new.drop(['version'], axis=1)
change_old = change_old.drop(['version'], axis=1)

change_new.set_index('Name', inplace=True)
change_old.set_index('Name', inplace=True)

diff_panel = pd.Panel(dict(df1=change_old, df2=change_new))
diff_output = diff_panel.apply(report_diff, axis=0)

changes['duplicate'] = changes['Name'].isin(dupe_names)
removed_names = changes[(changes['duplicate'] == False) & (changes['version'] == 'old')]
removed_names.set_index('Name', inplace=True)

new_name_set = full_set.drop_duplicates(subset=cols_to_show)

new_name_set['duplicate'] = new_name_set['Name'].isin(dupe_names)

added_names = new_name_set[(new_name_set['duplicate'] == False) & (new_name_set['version'] == 'new')]
added_names.set_index('Name', inplace=True)

df = pd.concat([diff_output, removed_names, added_names], keys=('changed', 'removed', 'added'))
df[cols_to_show].to_csv(file3)
Let’s see what we’ve done here with the help of Python and its Pandas package:
- Firstly, we’ve read our files into separate data frames
oldandnew. - Created a
report_difffunction to account for the changes between the files — it prints old and new values wherever a change has been made. - Added a
versioncolumn to both data frames to note the origin of each row when we later combine them. - Combined the contents of the two data frames and stored them in another data frame
full_set. - Removed duplicate rows, i.e. unchanged data, from
full_setand stored the remaining data inchanges. - Used the
get_duplicates()function to get a list of all names that are duplicated. We named the listdupe_names. - Using
isin, got a list of all duplicates,dupes. - Split
dupesbased on version to two new data frameschange_oldandchange_new. - Removed the
versioncolumn. - Set
Nameas our index for both data frames. - Into
diff_outputwe called ourreport_difffunction, and stored the rows where data has been changed. - Then we found out which item is removed from stock and saved it to
removed_names. - Now to find all new items, we checked for duplicates again, and filtered each row based on the item’s uniqueness AND presence in the ‘new’ data frame. This list was then saved as
added_names. - Finally we merged the three data frames with keys to differentiate the type of change —
changed,removedoradded— and we’ve written everything into a new CSV file.
At Last
Our final CSV file tevasale_changes.csv looks something like this:
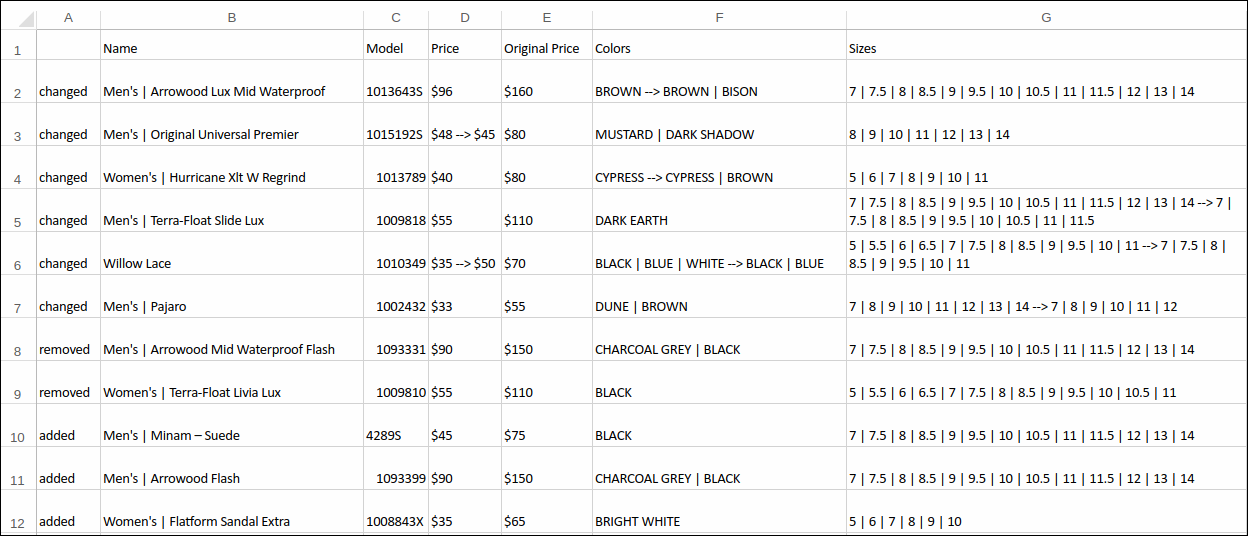
We can clearly observe additions, removals, and changes in details for each item.
Although the dataset used here was relatively small (~70 items in each file), the code still works for much larger data.
This is a helpful tool to track what changes your vendors have made to their stock. Hence you can easily implement them on your website and give your customers up-to-date and accurate information.
Once again, a huge thanks and gratitude to Chris Moffitt, on whose tutorial the codes are based.
Related reads: