This is one piece of a three-part series that looks at the various data analysis methods, techniques, and essential steps to ensure its superiority.
Data analysis, as defined by Wikipedia, is a key process within data science that involves inspecting, cleansing, transforming, and modeling data to uncover valuable insights, guide conclusions, and support decision-making.
Data is crucial to making informed business decisions, but only if you have the right analysis tools and methods to transform a raw data set into actionable information.
Every day new data finds its way to the web on the scale of zettabytes (that’s 1021 bytes!). Most of it ends up in repositories where it gathers the metaphorical dust, never seeing the light of day.
Data is only as good as the insights derived from it.
Once you make your mind up, and decide to use data to bolster your decision-making process, you might be tempted to believe that half the battle is won. Far from it.
Since there is no universal way to perform this analysis owing to the ambiguity associated with the sourcing, analysis and interpretation of data, businesses must look at this process strategically, in detail.
Five steps to superior data analysis
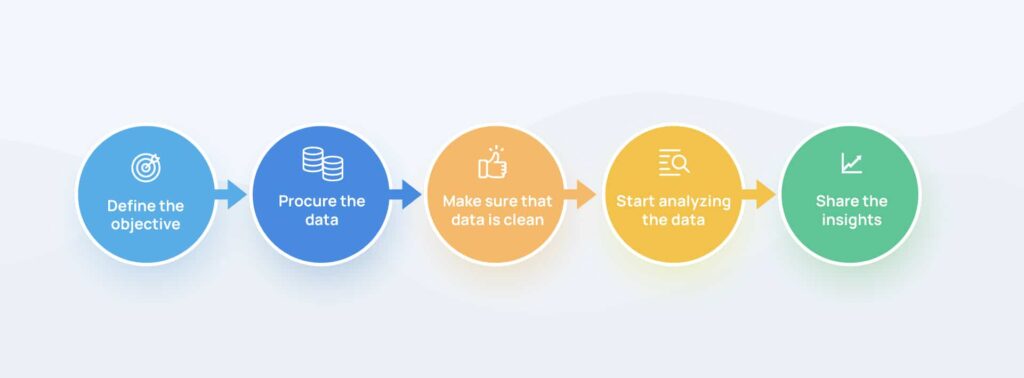
Data analytics starts with a problem statement and ends with actionable insights. Each step is as valuable as the next. Failure to internalize one step may lead to the deterioration of the entire process. So, we recommend that you pay heed to every step with equal esteem.
Let’s go over the steps one at a time.
1. Define the objective
Before delving into the subject, formulate key questions that you are seeking the answers to.
- Why has productivity taken a nosedive in my organization?
- Is there a correlation between sales and brand reputation? If so, to what extent?
- Are the customers looking for a particular kind of product?
Once you have adequately defined the problem statement, you can then begin to draft a working hypothesis that you can test along the way. Defining the objective will help you determine the sources you can extract data from, metrics you can measure, and the techniques you can use to run your analysis.
2. Procure the data
Once you define the pressing question, you can then move on to procuring the data. Considering the nature of the data sources will ultimately define the validity of your analysis, it is advisable to spend a good amount of time finding reliable sources.
Generally, data collection begins with internal sources, and moves on to external sources. Data collected from internal sources is gathered from within the company, whereas data collected from your clients and competitors (or any other source outside your organization) falls under external sources.
Internal sources:
- Customer Relationship Management software
- Internal databases
- Sales Analysis reports
- Enterprise Resource Planning software
- And more…
External sources:
- Google public data
- Social media data
- Government websites
- Industry websites
- Review websites
- And more…
In the age of Big Data, it is becoming increasingly common to extract data from secondary sources to reinforce data analytics. While the decision to go beyond primary sources rests solely on your shoulders, doing so can take your analysis to a whole new level.
If you need to collect vast volumes of data from diverse sources on the internet, you can always avail our Concierge services, which will help you get all the data you need, hassle-free.

3. Make sure that data is clean and structured
If your data is contaminated, you might as well stop the process right here, because everything you do hitherto will be nothing more than a zero-sum game, or worse!
We’ve repeated time and again the negative consequences bad data can have on your business. For, as is accepted worldwide —
Bad data is no better than no data.
Mel Netzhammer, Washington State University
It is not uncommon to find missing fields in a dataset. Not to mention faulty entries and outdated data. Structured data is easy for analysis software and data analysis tools to ingest, and the insights are much more valid.
At Grepsr, we use best industry practices, like data normalization, to ensure the integrity of your data. Moreover, our QA team, with its proven track record, implements strict guidelines to get rid of all the bad apples, and ensure that you have only the most accurate and structured data to work with.


4. Start analyzing the data
Once you’ve made sure that your data is clean, you can start analyzing it! You don’t need to be a data science wizard if you’re working with a relatively small amount of quantitative data. Common data analytics software and tools, such as Microsoft Excel, Tableau and Google Data Studio, are more than enough for statistical analysis.
But for more complex applications with various types of data, you can use the following techniques:
- Regression analysis
- Monte Carlo simulation
- Predictive analysis
- Prescriptive analysis
- Fuzzy logic
- Factor analysis
- Sentiment Analysis
- Cohort Analysis
Data analysts apply various kinds of analysis methods on your dataset to connect the dots in your strategy. Learn all about it here.

5. Share the insights
You’ve collected, cleaned, structured, and analyzed the data. Now it’s time to share it with the rest of the team, and interpret the results. This is when all the hard work you put into your analysis finally begins to bear fruit.
You can use data visualization tools to make it visually appealing, and easy to deduce. In other words, by using the power of data storytelling you can rally the entire team to achieve a particular goal with the insights gained from this exercise.
Keep in mind that you should not look to confirm your hypothesis, but accept whatever the result dictates.
Ask yourself the following questions:
- Does the data answer the question you asked in the beginning? How?
- Does the data enable you to make informed decisions? How?
- Are there more perspectives yet to be considered?
If your findings stand strong against all these questions, you are most likely headed in the right direction.
This way, you can effectively utilize your structured data, whether it’s for a straightforward analysis, or complex machine learning applications.
To conclude
If there’s one thing you take away from this article it’d be to make sure that the data you collect is of the highest order. Then, as per your need, you can choose the best data analysis process to glean actionable insights.
Data extraction, analysis, or visualization — the one thing common to all these terms is data, and you must work with the highest quality, from the get-go. For that, you can always count on Grepsr!