“Data is what distinguishes the dilettante from the artist.”

What’s the first thing you think of when you hear “Data”?
Most individuals start imagining the flow of numbers, facts & figures neatly illustrated in an Excel file. It all makes perfect sense because these represent Quantitative Data.
These data are crucial for a business to make decisions based on prediction and forecasting. But then again, think about the texts, photographs, audio recordings, and other non-numeric forms of information.
Such concepts, that are not expressed in numbers but are equally valuable for in-depth analysis of a situation are Qualitative Data.
In this blog, we will delve deeper into the meaning of qualitative data, its analysis, and its examples. We will also learn why you should extract qualitative data by web scraping for qualitative data analysis.
What is Qualitative Data?
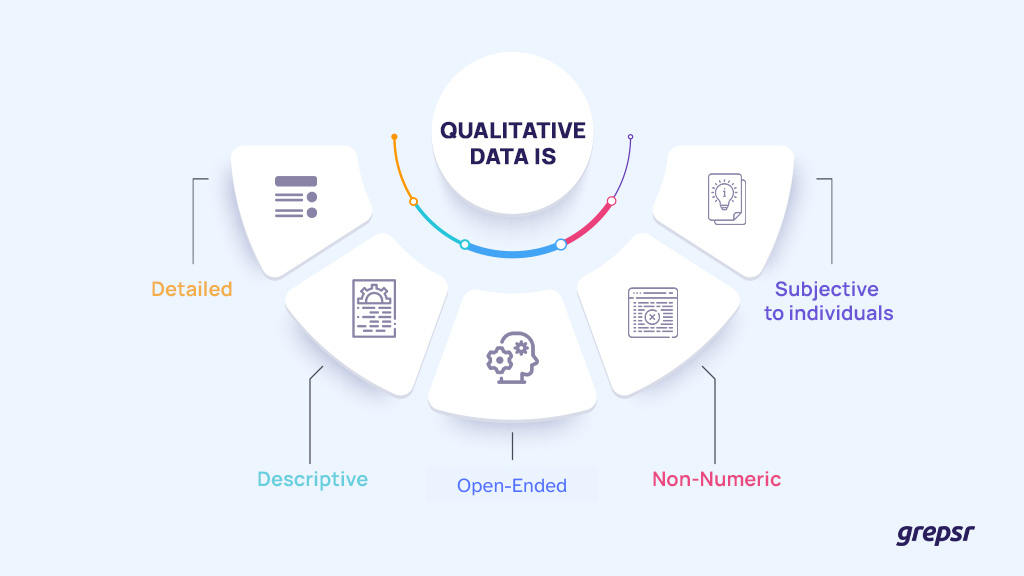
Qualitative data is known as the type of data that represents sentiment in any medium of expression (mostly textual). It is detailed, descriptive, open-ended, non-numeric, and subjective to individuals.
It is more categoric than numeric and goes beyond numbers to gain insights from the experiences of people.
As we know from our previous blog qualitative and quantitative data analysis methods, quantitative data is distinct from qualitative data.
Qualitative data doesn’t help in statistical analysis but quantitative data does. Both are diverse in terms of data representation and metric measurement.
Types of Qualitative Data
As mentioned before, qualitative data is tough to interpret for further analysis. However, the resources to collect qualitative data are abundant.
- Case Studies: They are textual forms of qualitative research that focus on the in-depth evaluation of a particular individual, culture, or organization to assess intricate social phenomena, such as what factors contribute to workplace bullying, etc.
- Interviews: The data collected from interviews can be audio recordings or interview transcripts. They are typically conducted one-on-one followed by a series of questions designed to explore the person’s attitude and opinions regarding a specific topic.
- Focus Groups: This is similar to an interview but the only difference is that a focus group is a group interview with people of similar demographics. The data collected from this is the opinions and responses of interviewees to the discussion topic.
- Observations: Data is collected from the real-world context where direct observation of people, their interactions, shifts in emotions, etc. are observed when a particular situation takes place in the natural setting.
- Open-ended surveys: This type of qualitative research design allows individuals to answer questions without any restrictions so data collection is filled with rich, detailed information about their experiences and behaviors.
- Social Media Content: Qualitative data from visual formats such as images, photographs, videos, infographics, and other forms of content like post comments, can be collected from social media for public insights.
- Ethnographic Data: Information collected from the field notes by immersing in studying people in their culture and habitat is another form of collecting qualitative data.
Now, you can perform further analysis by collecting any of these forms of qualitative data.

Qualitative Data Analysis
Qualitative Data Analysis is the process of organizing, analyzing, and interpreting the data collected from qualitative research. Analyzing qualitative data is quite complicated, so data analysts segregate it into 3 categories.
- Binary Data: Numerically represented by the combination of zeros and ones. It is used for studying a subject that has either one or the other result. Such as yes/no, positive/negative, up/down, right/wrong based scale, etc.
- Nominal Data: This is used to label mutually exclusive categories that cannot be denoted as a numeric value. Such as gender, ethnicity, college major, mode of transportation, etc.
- Ordinal Data: Categorized in an order or a ranging scale. The values have clear rank order but lack an even distribution. Such as income: low/medium/high, education level: undergraduate/graduate/postgraduate, etc.
Examples
Here’s a simple example of qualitative data analysis.
Imagine a situation where you are assessing the results of your newly released product “Chic Sunglasses” marketing campaign. Now, quantitative data is the number of customers who bought your product in the given time.
Whereas, qualitative data is the information that explains the reason for individuals to choose your product over the other.
Extracting data from customer reviews from external sources is a way to collect qualitative data. After data collection, the process of analyzing the review, ratings, and feedback data is known as sentiment analysis.
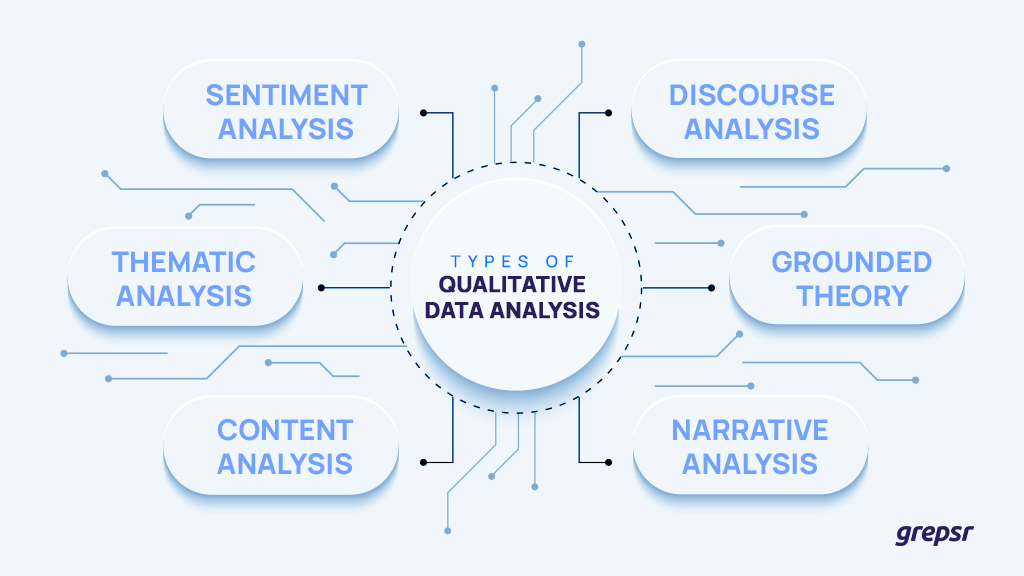
Similar to sentiment analysis, there are other examples of qualitative data analysis such as:
- Thematic analysis: This is a way to evaluate the patterns of meaning in a data set from the answers of focus groups or interview transcripts to provide rich and detailed results from the phenomenon under investigation.
- Content analysis: This is used to explore the relevance, frequency, and engagement of certain textual, and visual data on social media, search engines, and more.
- Discourse analysis: You can perform discourse analysis to assess a certain speech or conversation that takes place in a specific context, culture, and social setting. This includes analyzing power dynamics, cultural influences, and social norms within the discourse.
- Grounded theory: You can formulate a theory from the data you have at hand itself. By revising it and having it go through a series of tests, themes, and categories are formed organically during the analysis process.
- Narrative analysis: This is essentially analyzing the storytelling of people and breaking down its meanings for interpretation and insights. It involves examining the structure, content, and meaning of narratives.
Sample
Now for the sample, let’s add to the example from above.
The team decided to send a survey form to the customers who bought the Chic Sunglasses.
The questionnaire is made up of queries that reflect the user’s motivation to buy the sunglasses.
What influenced their purchasing decision, how they felt initially, what could have been better, and how they now feel towards the brand?
The goal is to hear the customer’s voice and empathize with them to improve the overall experience.
All the possible answers to these queries that come from the respondents are qualitative data.
Hence, Qualitative Data Analysis is applied here in assessing customer satisfaction, consumer behavior, and shifts in market trends following their product launch.
Final Note
In conclusion, qualitative data analysis serves as a vital tool for understanding the nuanced aspects of information beyond numerical representation.
While quantitative data offers statistical insights, qualitative data, comprising non-numeric elements like texts, images, and opinions, provides a profound understanding of human experiences and sentiments.
Leverage the power of qualitative data to empathize with the customer’s voice and lead your business toward growth and profitability.
Take the leap with Grepsr, where excellence meets your data needs. Unleash the power of unparalleled data quality and make every insight count.


