
Find out how you can perform data QA with Python. Data refinement is a big headache for data scientists and data analysts. As we’ve mentioned time and again, most data practitioners spend 50 to 80 percent of their time refining data. To get over this hurdle, we have various systems in place to ensure the superior quality of your data.
In one of our earlier articles, we learned how to extract data from the web using Python. Out of the many learnings we had, the major takeaway was that dealing with large volumes of data is never a straightforward process.
More often than not, we do not use the data as soon as the crawler is done extracting the data.
We must deal with several complexities before the data is ready for deployment. Various Quality Assurance techniques come into play to properly verify the integrity of a dataset.
In this article, we will look at a few Pythonic ways to ensure the superior quality of a dataset to remedy the qualms associated with your business use cases.

Why use Python for your data QA
Python is a general-purpose programming language that is very intuitive to use. It has an extensive community and multiple libraries, including but not limited to, pandas, scikit-learn, and pyspark.
These libraries can address almost all your data analysis and manipulation needs. To be more specific, pyspark provides an API for Apache Spark that enables large-scale data processing in real time.
Therefore, Python is the optimal choice for data processing and validation. For ease of understanding, we will use pandas for the remainder of this blog.
Data QA Black Box testing with Python

Black Box in general, is a method of software testing that examines the functionality of an application without peering into its internal structures or workings.
Drawing inspiration from this wildly successful software testing method, we’ve created a Black Box of our own, a Data QA Black Box, so to speak.
At Grepsr, it is the point of inception of all our QA processes. We use it for automatic testing to flag abnormalities in a dataset.
The QA team passes each and every data project through the Black Box. Based on pre-set statistical and logical processes, it delivers a sample report. We use the sample report to draw meaningful insights and make the necessary changes.
Since it is not plausible to generalize data integrity with the same set of processes, we customize the Black Box frequently, as per the requirements. You are more than welcome to share your concerns. We can update the scripts of the Black Box according to your suggestions.
Undoubtedly, this allows the QA team to address the anomalies a dataset may have, and discover ways to rectify them.
From here on, the test_dataset.csv will be the main dataset we will work on. Let’s start by loading it into the pandas.DataFrame.
import pandas as pd
import chardet
import re
import numpy as np
with open("./test_dataset.csv", "rb") as f:
enc = chardet.detect(f.read())
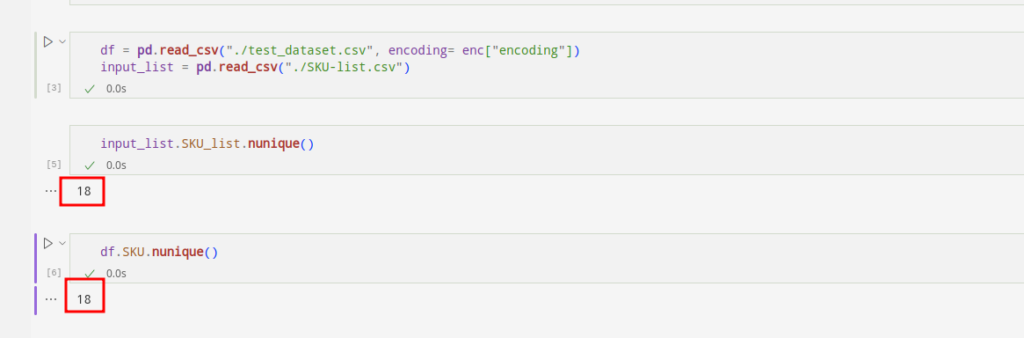
df = pd.read_csv("./test_dataset.csv", encoding= enc["encoding"])
df.dropna(how="all",axis=0,inplace=True)First things first, you get the data in the encoding you prefer. We have a distinct script to address those kinds of concerns.
Requirement analysis for your Data QA project with Python
The first step in the QA process is to check whether the dataset conforms with your requirements. Let’s walk through some of the use cases:
1. Input list comparison
In many use cases that we come across, our clients expect us to crawl the products with specific SKUs. To meet the requirements, we tally the incoming SKUs with the predefined list of SKUs.
Let’s see if the SKUs are identical:
df[~df.SKU.isin(input_list.SKU_list.unique().tolist())].loc[:,"SKU"].unique().tolist()input_list[~input_list.SKU_list.isin(df.SKU.unique().tolist())].loc[:,"SKU_list"].unique().tolist()
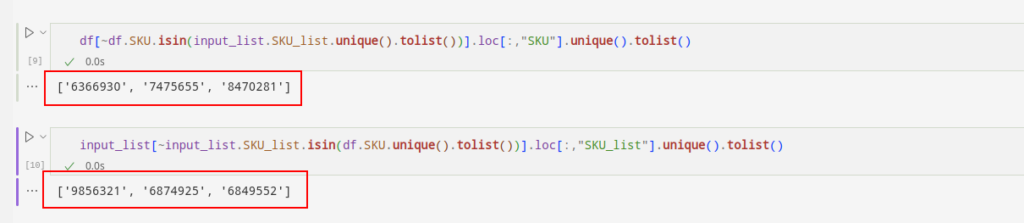
We can see that the first list of SKUs shows the missing SKUs. The missing ones are present in the input sheet but not in the dataset. The second list of SKUs shows an opposite predicament.
This way, we can figure out the missing SKUs and add them to the original dataset you need.
2. Follow the rule
If there is a column in your dataset for which we can define rules then we implement those rules in our script. We can ensure the integrity of your dataset by running those scripts.
Let’s say you are pulling product_code from an e-commerce site which has a combination of 1 alphabet and four numbers. By implementing a script, we can flag the products which do not comply with its rules.
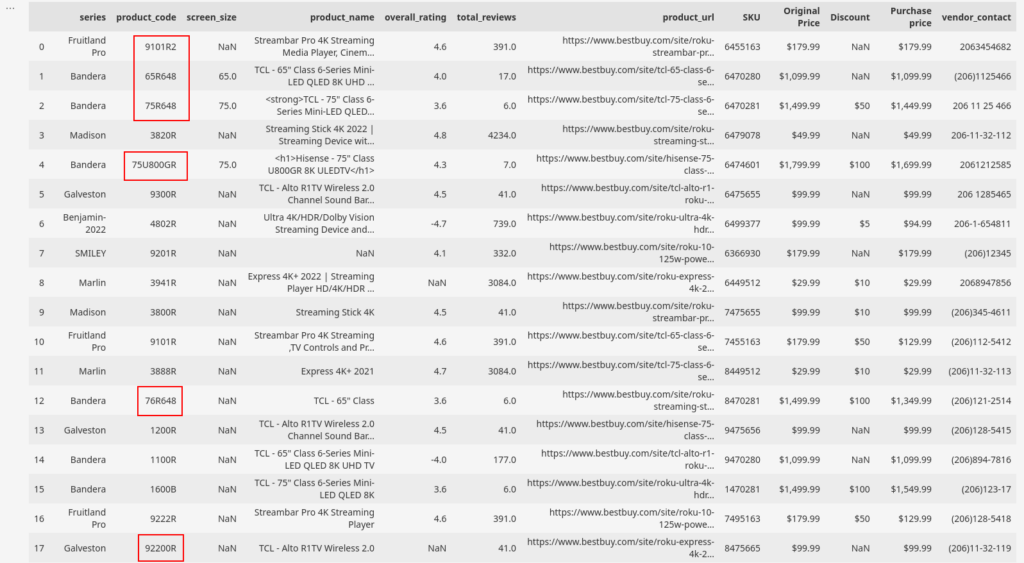
The highlighted sections above are the anomalies in our dataset. They do not comply with the rules. In this particular case, the dataset is small, so we can pinpoint the anomalies without much hassle. But, when the datasets are bigger, the complexities convolute as well. It will be trickier to filter out the oddities as we did here.
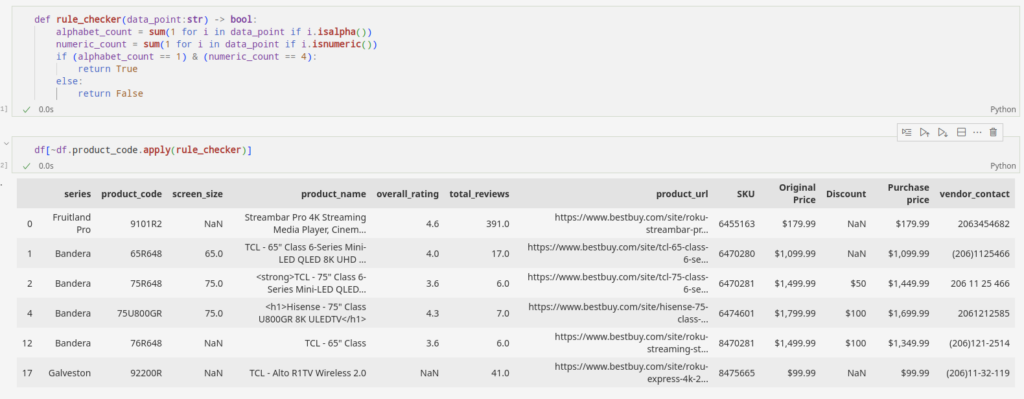
def rule_checker(data_point:str) -> bool:
   alphabet_count = sum(1 for i in data_point if i.isalpha())
   numeric_count = sum(1 for i in data_point if i.isnumeric())
   if (alphabet_count == 1) & (numeric_count == 4):
       return True
   else:
       return False
df[~df.product_code.apply(rule_checker)]This handy tool in Python can do the heavy lifting for us. We can either filter the oddities out of the dataset or update the crawler to address such issues.
Flagging abnormalities in the dataset for QA
The next step now is to locate the probable irregularities in our dataset. Irregularities here are those data points that fail to comply with the logic of our data points. Let’s walk through the following examples to fully grasp the inconsistencies we might encounter in a dataset:
1. Missing data fields
It is quite likely to receive empty data fields when extracting data for the first time. For the QA team, this is the time to get to duty.
After analyzing a sample dataset that the Black Box comes up with, through an extensive statistical analysis, we get to work.
The sample dataset addresses all the missing fields in the dataset. Based on them, we validate the missing points manually. But, that’s not all. We can customize the scripts to address specific cases by setting priorities for the columns that are important to you.
For example, you cannot have an empty product_name data in an e-commerce dataset. Thus, we resort to the sample report to locate the missing variables.
Here is a simple Python code that filters out abnormalities. It enables us to impute the missing values in the dataset. We will get into the nitty gritties in the post-processing section later.

2. Logic inspection
Another knot the Black Box helps us untangle is the logical inspection of the columns in our dataset. For a more clear understanding, let us consider the phone number field.
This data field has fixed rules regarding the country code and numerical count. For example, US phone numbers consist of ten digit numbers along with the area code. Whenever we find columns of phone numbers and countries, we pull information from the metadata database and apply logic accordingly.
Let’s say, based on the area code available and after a quick look into the metadata, we find out that the phone_numerical_count is 10. Proceeding forward with this information, we can separate data points that do not abide by this rule.
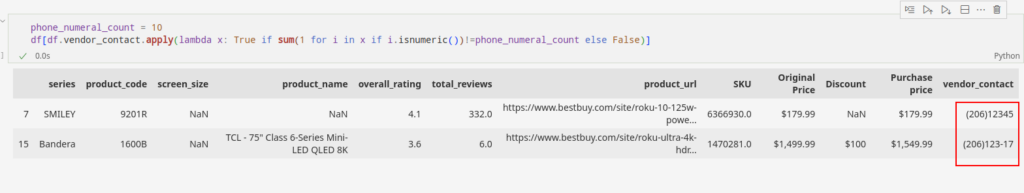
phone_numeral_count = 10
df[df.vendor_contact.apply(lambda x: True if sum(1 for i in x if i.isnumeric())!=phone_numeral_count else False)]
This was a simple depiction of how we created samples based on field logic we set up in the script. There are many statistical and logical operations that are written into the Black Box to create an inclusive anomaly sample.
Data QA post-processing
Data points we pull from web sources are not always readily usable. Some embedded anomalies can hinder the integrity of the dataset and slow down decision-making.
Data QA post-processing allows us to not only maintain high data quality but also ensure faster delivery of the data projects. We do that by significantly reducing the TAT (Turn Around Time).
Let’s explore a few post-processing techniques our quality experts often find themselves engrossed in now and then.
1. HTML tags in the text field
We often send the raw data we scrape from the web through various processing stages. When the raw data is made accessible directly via an API, we can reasonably expect it to be devoid of HTML tags. However, the situation is starkly different when we extract the data by parsing HTML documents.
In such circumstances, the presence of HTML tags within the dataset becomes a major concern. Further analysis may be complicated by the content embedded within the HTML tags.
No worries though. You can implement regular expressions into the field to rescue the dataset. Find a snippet of Python code below to remove the HTML tags from your data points:
def remove_tags(raw_text):
   CLEANR = re.compile('<.*?>')
   cleantext = re.sub(CLEANR, '', str(raw_text))
   return cleantext
The sample dataset considers data embedded within the HTML tag:
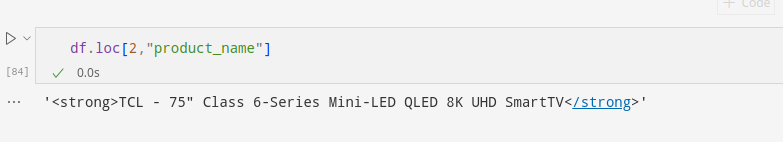
We apply the remove_tags function on the columns containing the anomaly. It will remove the HTML tags and produce clean data as a result.
Here, we apply this function to the product_name column to eliminate the HTML tags in any instance:
df.product_name = df.product_name.apply(lambda x : remove_tags(x) if pd.notna(x) else np.nan)It will eliminate HTML tags from all instances in the column if they exist.
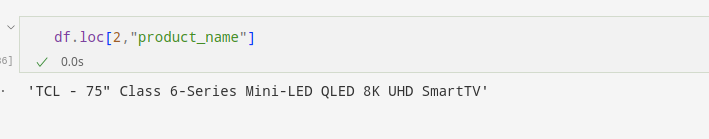
We can very clearly see that the product name from the second row is free from the HTML tag.
Likewise, we can remove any strings, characters, and numbers from the data field found to be compromising the integrity of the dataset.
2. Imputing the empty fields
The lion’s share of datasets come in the categorical and numerical format. Like we discussed above, getting empty fields in a dataset is often inevitable.
We take this particular step to validate the missing data fields when the data point is missing even from the source website.
If you require us to impute the missing data fields to make sense out of the dataset then we can proceed accordingly.
For instance, you can assign the missing field in a categorical data by assigning values using the mode value or through the regression approach.
Whereas for numeric data you can use statistical tools like the mean, median, and linear regression.
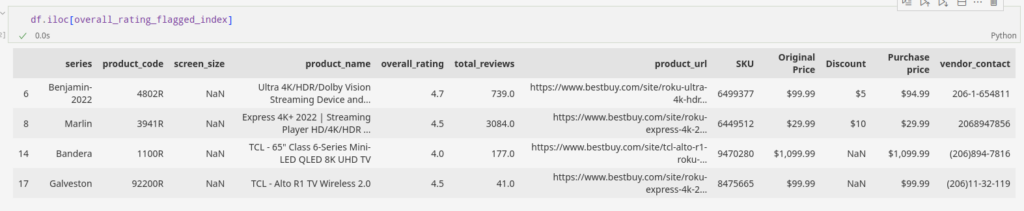
Let’s look at the overall_rating column for this case. A negative value in the field can skew the imputation value. So, the first step we take is to ensure if the field can have negative values. We know that in this case, the values can’t be negative.
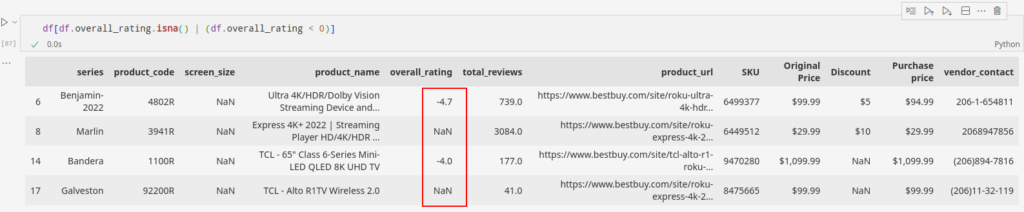
The data has negative as well as empty values in the overall_rating field. Let’s store the indexes of these fields and proceed towards solving them.
overall_rating_flagged_index = df[df.overall_rating.isna() | (df.overall_rating < 0)].indexThis simple code below ensures that the overall_rating is free from any negative entries.
df.overall_rating = df.overall_rating.abs()Now, moving forward to imputation. Let’s put the median value in the missing fields of the column.
df.overall_rating.fillna(df.overall_rating.median(), inplace=True)After the use of this simple technique, we can see that we have maintained the field information to the highest degree possible.
We can impute the missing data fields through several univariate and multivariate techniques. That being said, most of the time we find ourselves coming back to the nearest neighbor imputation technique.
3. Cross column relation
We often find datasets with two or more columns relating to each other based on field logics. Specifically, in the given sample data, such columns exist where the attribute “Discount” can be derived from the attributes “Original Price” and “Purchase Price“.
Alternatively, we can say that the “Purchase Price” attribute is derived from the attributes “Original Price” and “Discount“. Here is a subset of our dataset to demonstrate the above relation.
df[['Original Price', 'Discount', 'Purchase price']].head(10)
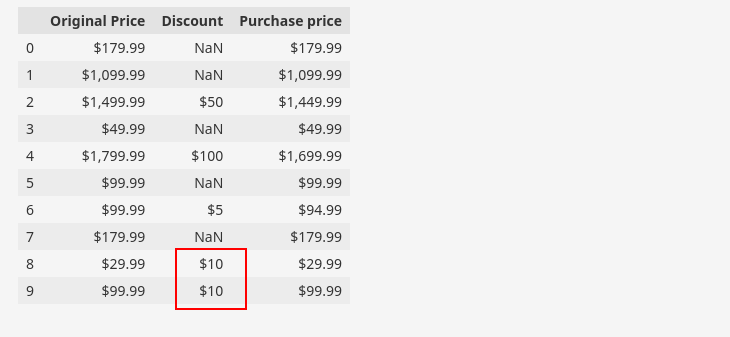
We can use the relationship to validate the accuracy of our data. In the figure given, we have highlighted an invalid instance, indicating that the data suggests either the purchase price or discount price is invalid for that particular row.
Using Python for data QA
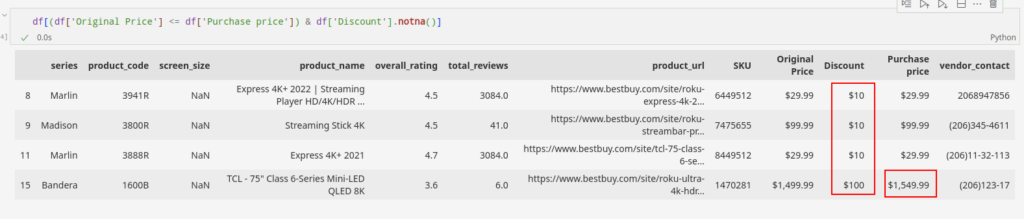
We can identify such rows using Python code, as demonstrated below:
df[(df['Original Price'] <= df['Purchase price']) &
df['Discount'].notna()]
After inspecting such invalid relationships on the web by our manual team, we can determine whether the discount, purchase price, or original price is invalid.
Once we have identified the specific attribute that is invalid, we can proceed with post-processing steps to ensure the validity of the instance.
The post-processing steps involve finding the correct data and imputing it to replace the invalid values.
In our sample dataset, the presence of the “$” sign in the non-empty instances causes the instances in the “Original price,” “Discount,” and “Purchase price” columns to be string instances.
To perform calculations or comparisons on these values, it is necessary to convert the string to a numerical format by removing the currency symbol.
df['Original Price'] = pd.to_numeric(df['Original Price'].str.replace('[^d.]', '', regex=True), errors='coerce')
df['Discount'] = pd.to_numeric(df['Discount'].str.replace('[^d.]', '', regex=True), errors='coerce')
df['Purchase price'] = pd.to_numeric(df['Purchase price'].str.replace('[^d.]', '', regex=True), errors='coerce')
Now that the price values are converted to float, we can proceed with further calculations. Based on our manual inspection of the sample data, we consider the discount and original price to be valid. Therefore, we can perform calculations and analysis using these values.
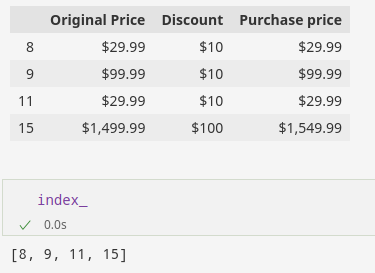
This way, you can find the index for which the invalid row exists.
index_=list(df[(df['Original Price']<=df['Purchase price']) & df['Discount'].notna()].index)
Now , we replace the invalid purchase price with the correct price i.e. Purchase price = Original Price – Discount.
Python code for such operation is:
df.loc[index_,'Purchase price']=df.loc[index_,'Original Price'] - df.loc[index_,'Discount']We can verify the validity of the updated values by checking the indices of the previously invalid rows.
df.loc[index_,['Original Price','Discount','Purchase price']]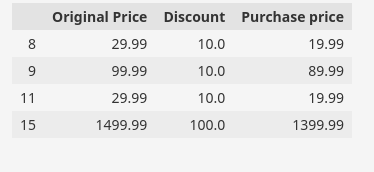
Agile development in data QA Black Box testing
Like all other processes in Grepsr, even the development of the data QA Black Box happens in an agile way.
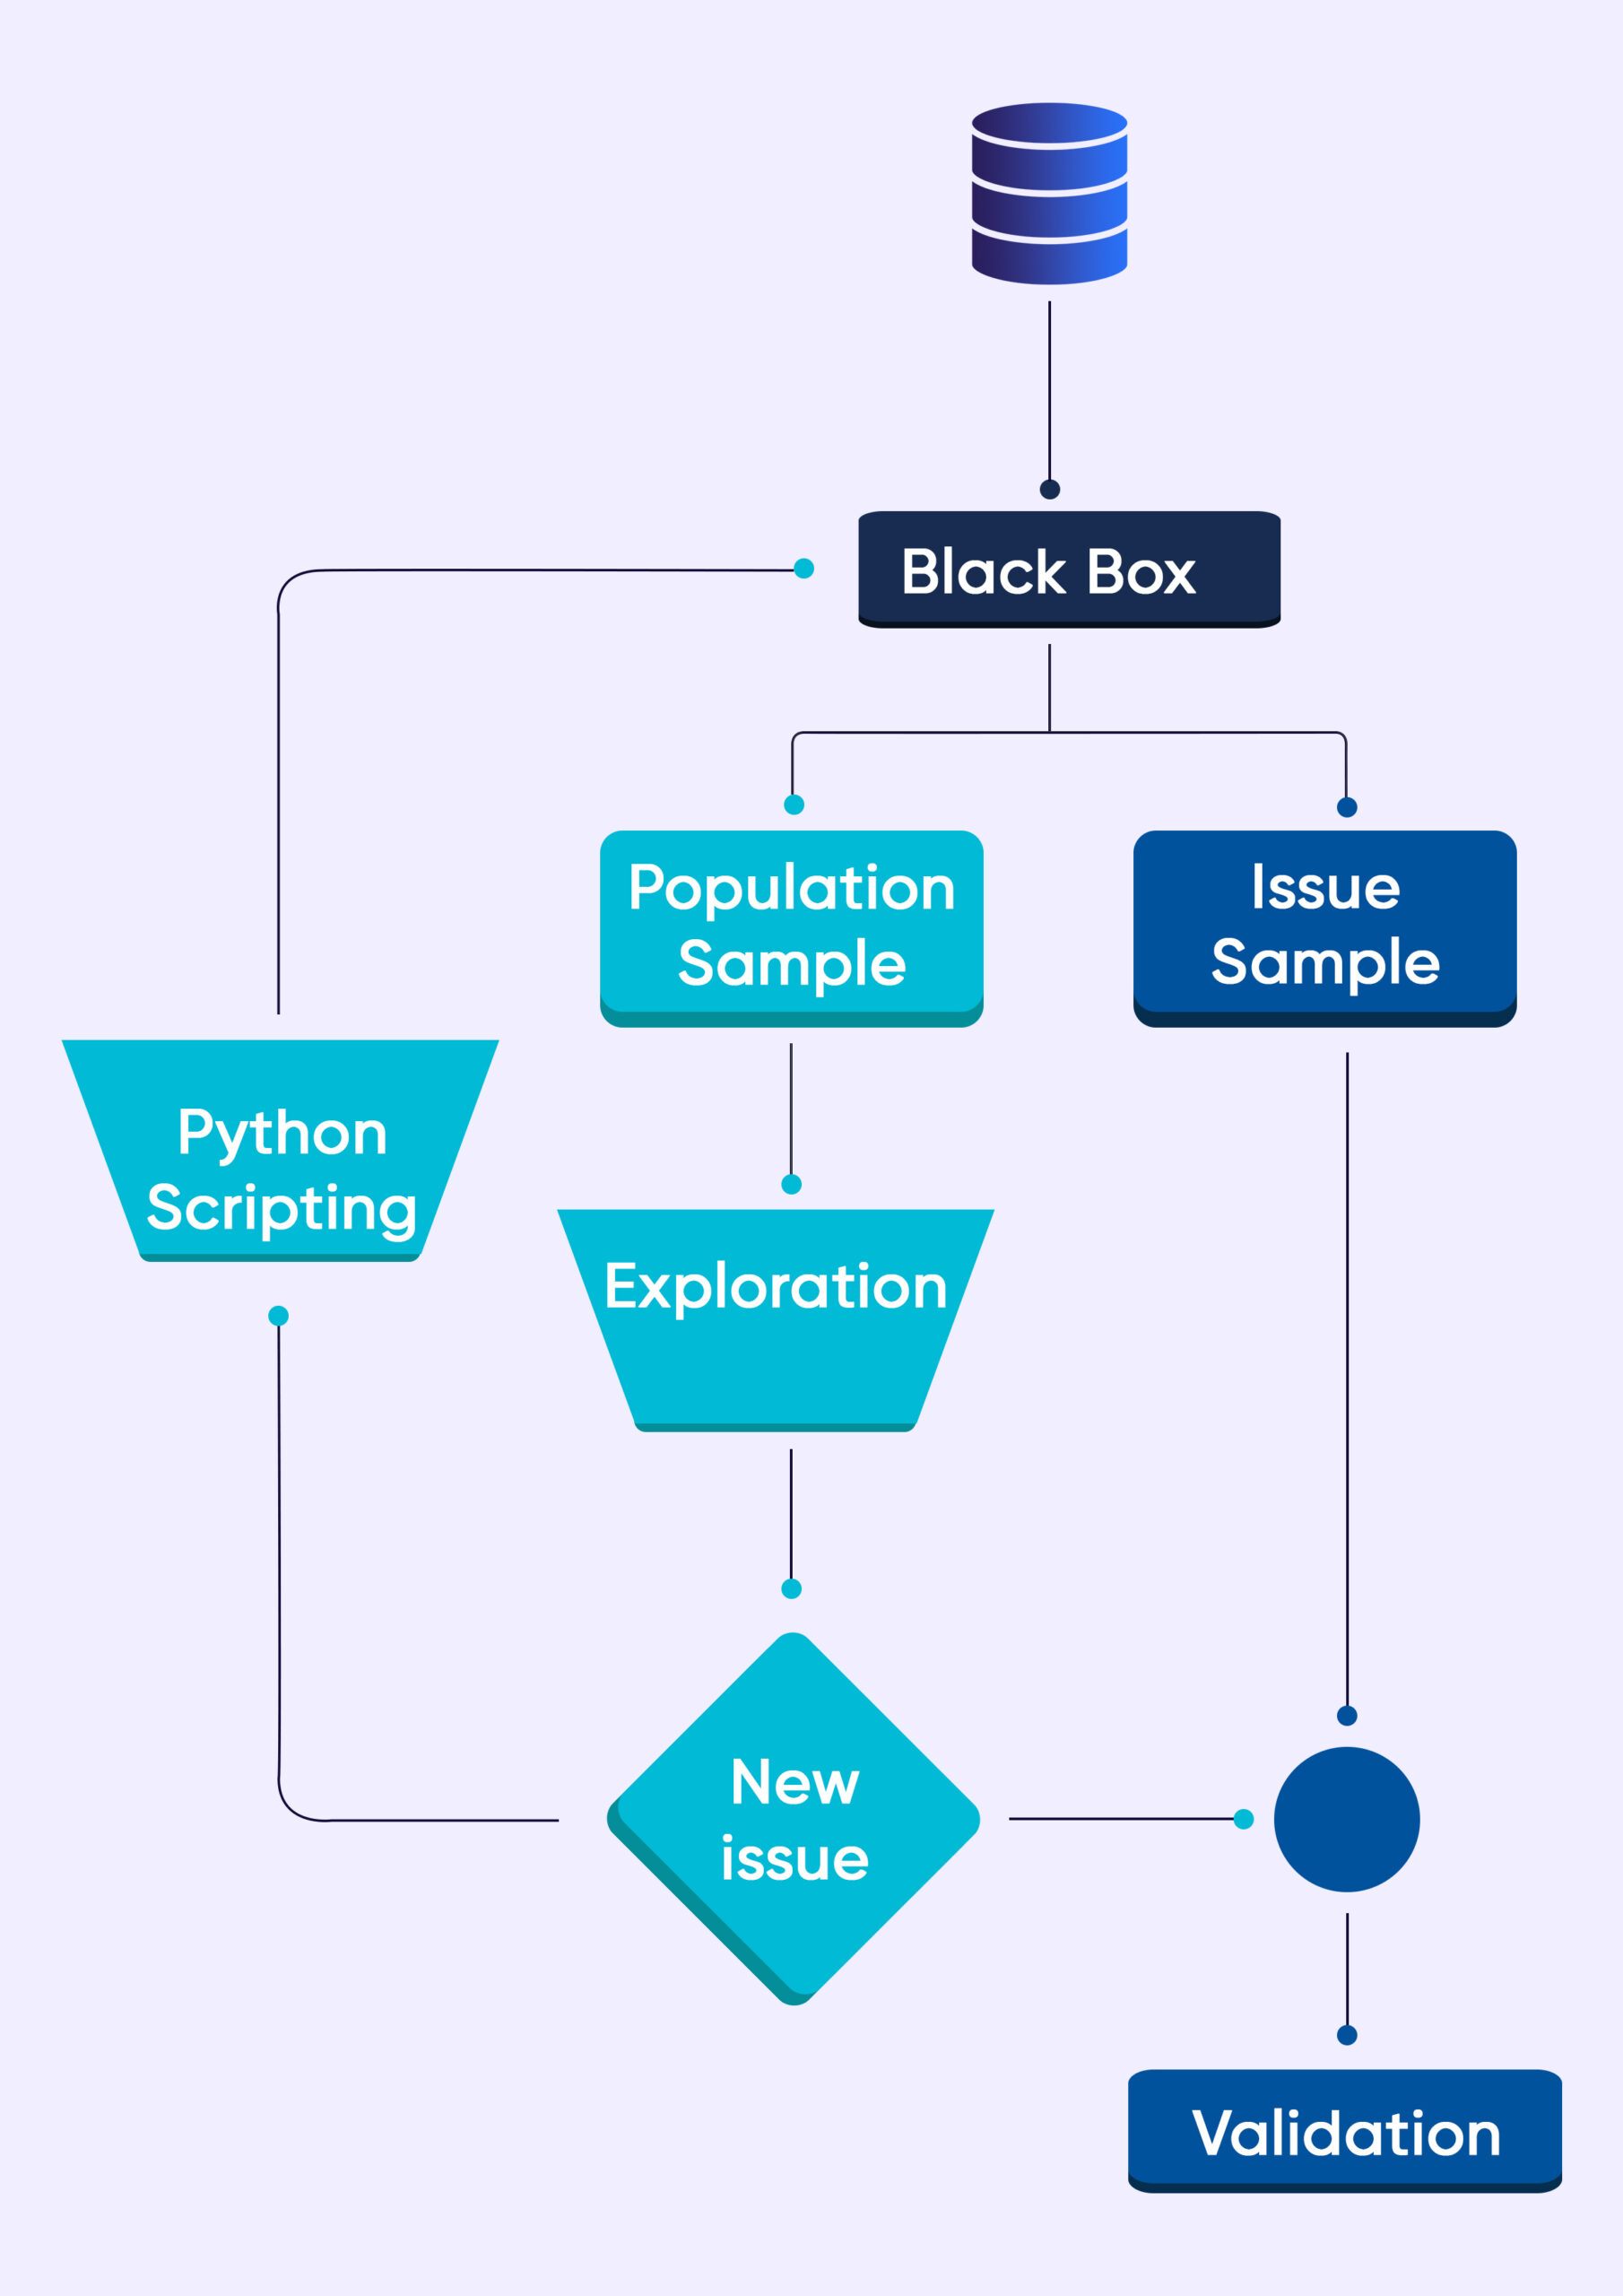
The flowchart above shows a simple way of how we go about doing it. When we feed the data into the black box, it generates two sample datasets.
Sample 1 comes out as a result of random sampling. Sample 2 consists of the data which helps us verify the issues ( a predefined set of rules already in the Black Box is responsible for this).
Our Manual QA experts review the population sample. If we find previously unseen issues, our QA automation experts write new scripts (issue detection mechanism) to feed into the Data QA Black Box.
All the better if we don’t detect issues in the sample dataset. Our QA team performs further data exploration and manipulation. In many instances, we relay our findings to delivery engineers.
After that, the engineers enhance the crawlers to make room for the new discovery.
The Data QA Black Box mechanism operates with a rigorous probabilistic framework, diligently scrutinizing the recorded data for any disparities or anomalies. We leverage advanced mathematical techniques to detect probabilistic patterns.
This way, we can perform precise Quality Assurance on large datasets and radically improve our TAT (Turn Around Time).
To conclude
This blog explains but a small fraction of the processes and tools we use to ensure data quality.
Our Black Box testing approach, backed by Python and its libraries, empowers us to handle complex data quality issues effectively.
We can customize the Black Box scripts to cater to your specific data quality requirements.
Regardless, you can rely on Grepsr to receive delivery of high-quality data that aligns with your business goals.
Related read: