Risk rarely arrives as a single clear warning; instead, it builds up through smaller signals: a regulator updates guidance, a supplier appears in negative news, a public filing shows weaker liquidity, or a vulnerability begins affecting products used across the industry. By the time those signals reach a quarterly risk review, the client may already be exposed.
That is why risk assessment web data is becoming useful for consulting teams. Public sources can help analysts monitor regulatory change, news, filings, vulnerability data, commodity shifts, supplier behavior, and market sentiment in a repeatable way. The goal is not to replace expert judgment. It is to give that judgment fresher evidence.
For risk consultants, the value lies in external data that is cleaned, validated, and connected to dashboards or models. A stronger risk workflow does not depend on one report. It keeps watching the market around the client.
Why does external data belong in risk assessment?
Internal data shows what is happening inside the organization: incidents, vendor performance, audits, losses, controls, and payment history. External data shows what is changing outside it: regulation, credit pressure, cyber exposure, environmental events, supplier health, and public sentiment. Risk management needs both.
This matters because risks now cross categories quickly. A compliance update can become an operational risk. A supplier disruption can become a revenue risk. A cyber bulletin can become a board-level resilience issue. The Basel Committee’s risk data aggregation principles were created after the financial crisis exposed how poor risk data can impair timely decisions. The lesson is broader than banking: risk data must be accurate, timely, and usable when stress arises.
7 external data signals consultants should track
A useful risk program does not scrape everything. It starts with the decision the client needs to make and then tracks the signals most likely to change it. These seven categories are a practical starting point.
1. Regulatory changes and enforcement updates
Regulatory monitoring is one of the clearest use cases. Consultants can track regulator websites, consultation papers, enforcement releases, policy updates, and industry notices across markets. The output should be classified by jurisdiction, topic, deadline, severity, and business impact.
- New rules or draft guidance relevant to the client’s sector
- Enforcement actions against peers or vendors
- Deadline changes for reporting, disclosure, or resilience requirements
2. News and social signals for emerging risks
News, public commentary, forums, and social conversations can reveal reputational, operational, or geopolitical risk early. A single article may not mean much. A repeated pattern across credible sources can change the risk picture.
This is where risk analytics scraping helps consultants move from anecdote to pattern. For example, a team can group mentions around a supplier by source, geography, entity, topic, sentiment, and date to understand whether negative attention is isolated or spreading.
3. Financial filings and credit risk indicators
Credit risk is not only about internal payment history. Public filings, company announcements, legal notices, and financial disclosures can add context. In the U.S., the SEC EDGAR database provides public access to millions of filings, including keyword search, the latest filings, APIs, and RSS feeds.
- Liquidity warnings or debt disclosures
- Delayed filings or restatements
- Risk-factor language changes
- Legal proceedings or material event disclosures
4. Cybersecurity and threat intelligence data
Threat intelligence data can help risk teams monitor whether a client’s technology stack, vendor ecosystem, or sector is becoming more exposed. Public sources such as the NIST National Vulnerability Database and MITRE ATT&CK add structured context around vulnerabilities, tactics, techniques, and adversary behavior.
The useful output is not a generic cyber feed. It is a filtered dataset linked to business context: affected vendors, exposed products, critical systems, exploit maturity, and remediation priority.
5. Environmental and geopolitical indicators
Environmental and geopolitical risks often manifest as external movements: weather events, port disruptions, conflict risk, commodity price changes, sanctions, policy shifts, or trade restrictions. These signals matter for clients with global suppliers, logistics exposure, or commodity-linked costs.
Commodity data is a practical example. The World Bank Commodity Markets page publishes price data and market outlooks that can help teams track movements in energy, food, fertilizer, metals, and other raw materials.
6. Third-party and supplier risk signals
Third-party risk is hard to manage because vendors change faster than annual reviews can. External monitoring can track supplier websites, certification databases, review platforms, procurement portals, job postings, and local news. Slower delivery promises, negative employee sentiment, and rising product unavailability together may signal a supplier risk that is not yet visible in internal SLA reports.
7. Dashboard-ready risk indicators
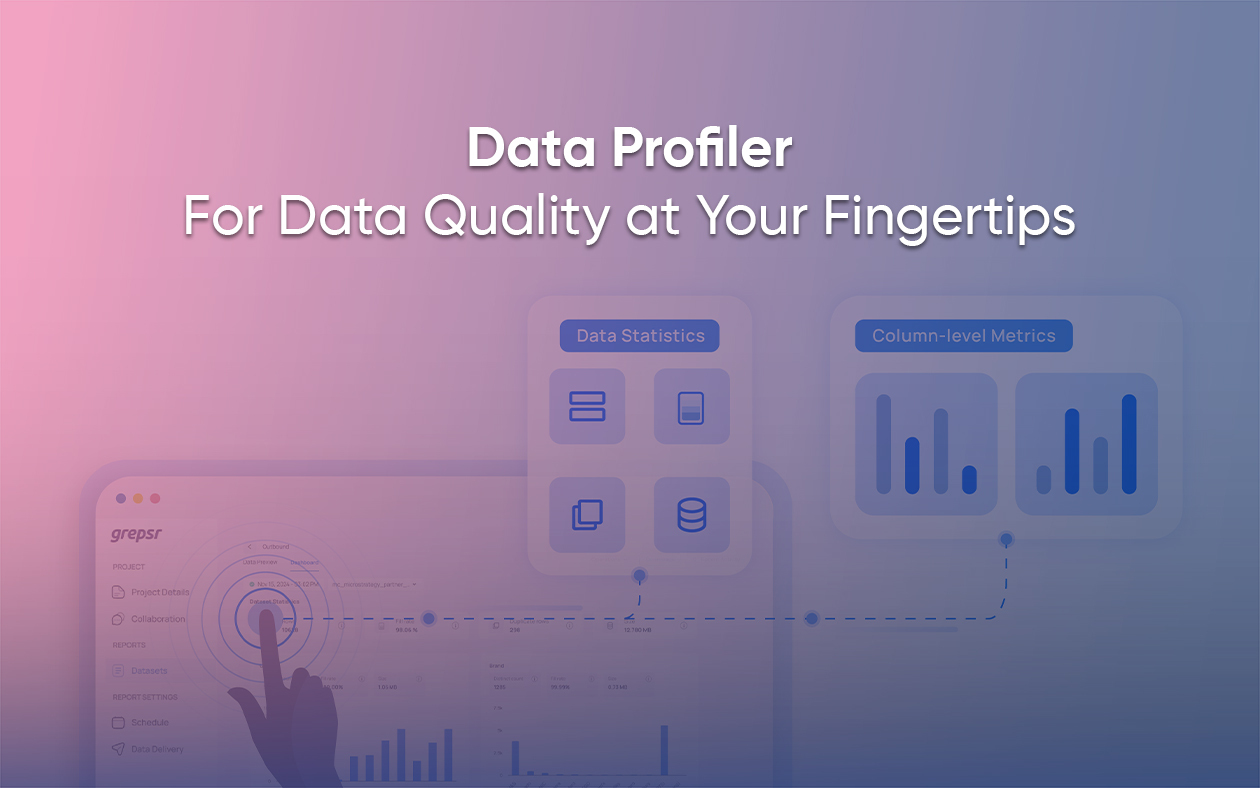
Risk data becomes useful when teams can act on it. A dashboard should not show every scraped field. It should answer a few recurring questions: what changed, which risks are rising, which entities are affected, what evidence supports the alert, and who needs to act.
- Regulatory changes by jurisdiction and deadline
- Supplier risk scores by region or category
- Financial distress indicators by entity
- Cyber alerts mapped to products or vendors
- Environmental and geopolitical events by location
Cloud vs on-prem data extraction: what fits risk workflows?
The cloud vs on-prem data extraction decision depends on sensitivity, scale, control, and integration needs. Cloud extraction is well-suited to public web monitoring because consultants can quickly scale resources and deliver data to BI tools, warehouses, or APIs without maintaining scraping infrastructure. On-prem extraction may be better when the workflow touches highly sensitive internal systems, strict data residency requirements, or controlled enterprise networks.
For many consulting-led risk workflows, a hybrid model is practical. Public external data can be collected via managed cloud pipelines, while sensitive internal risk data remains within the client environment. The two layers meet in dashboards, warehouses, or controlled analytics workspaces.
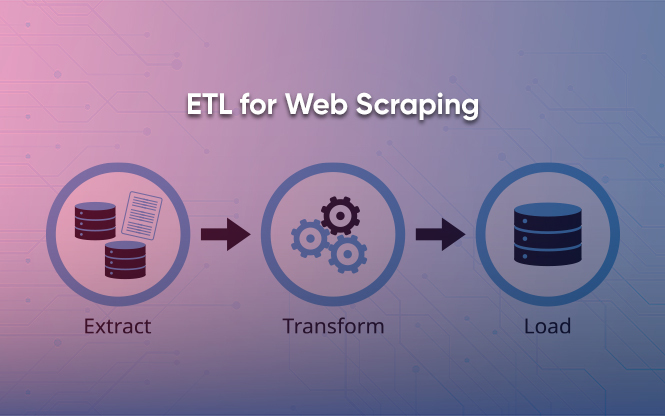
How to build a reliable risk data pipeline
A strong pipeline starts with the risk decision, not the source list. Before collection begins, consultants should define whether the data will support compliance tracking, vendor risk, credit monitoring, cyber exposure, market risk, or executive reporting.
- Define the risk question and the action the data should trigger.
- Select credible sources and document why each one matters.
- Set refresh frequency based on how quickly the risk changes.
- Normalize entities, locations, dates, categories, and severity fields.
- Validate missing fields, duplicates, outliers, and source changes.
- Deliver outputs into dashboards, spreadsheets, APIs, or warehouses with source traceability.
Responsible collection also matters. Risk assessment should focus on public, permitted, non-sensitive data and avoid unnecessary personal data collection. For regulated clients, documentation around sources, frequency, data handling, and limitations is part of the control environment.
Where Grepsr fits?
Grepsr helps consulting and enterprise teams turn public web sources into structured, validated, and delivery-ready datasets. Its Data-as-a-Service model focuses on managed extraction, cleaning, quality checks, and delivery, while the Web Scraping API supports recurring feeds for teams that want production-ready data access. For consulting teams, Grepsr’s management consulting data solutions are especially relevant because risk projects often require multiple sources
Risk management consulting becomes stronger when external data is treated as a repeatable intelligence layer. Regulatory monitoring, financial filings, news, threat intelligence data, commodity indicators, supplier changes, and geopolitical signals can all improve how teams identify and prioritize risk.
The advantage is not more data. It is better timing, cleaner structure, and clearer action. With the right pipeline, risk assessment web data can move from scattered public signals into dashboards and reports that help clients act before small changes become serious exposure.
Frequently Asked Questions
What is risk assessment web data?
Risk assessment web data is external, publicly available data collected from online sources to help identify, monitor, and evaluate business risks.
How does risk analytics scraping help consultants?
It helps consultants collect risk signals repeatedly and structure them for analysis, reducing manual monitoring and making patterns easier to see.
What sources are useful for regulatory monitoring?
Useful sources include regulator websites, enforcement releases, consultation papers, legal updates, industry notices, and public guidance pages.
Can scraped financial data support credit risk assessment?
Yes. Public filings, corporate announcements, legal notices, and financial disclosures can add context when mapped correctly to entities and sectors.
What is threat intelligence data in risk management?
It is information about vulnerabilities, adversary behavior, attack techniques, exposed systems, or cyber risk patterns.
Should risk data extraction be cloud-based or on-prem?
Cloud-based extraction often suits scalable public web monitoring, while on-prem setups may be preferred for sensitive internal systems or strict data residency requirements.
How can risk data be integrated into dashboards?
Risk data can be delivered through APIs, warehouses, BI tools, spreadsheets, or alerting systems once fields such as entity, location, date, source, severity, and risk category are normalized.