The importance of data quality cannot be overstated. One wrong entry and the corruption will spread without exception. The best way to counter this threat is to set up effective data quality metrics.
Consider the following scenario:
If you are in the airline industry, then you know that setting up the fare structure is quite daunting.
You would typically consider the following aspects before making decisions:
- The cost of the flight (fuel, administrative costs, labor costs, etc.)
- The historical pattern of business on the route
- Macroeconomic factors
- The prices set by competing airlines
Read about the importance of airfare data here:
Now, there is not much Grepsr can help you with on the first point, but as far as other factors are concerned, receiving and implementing the insights gained from airline data could define the trajectory of your sales for the upcoming quarter.
Say, you fail to consider the airline price of one of your competitors during Christmas. You miss the opportunity to make the most of your round-travel passengers in another circumstance.
If only you had access to correct historical data, which showed that focusing more on round-trip travelers from the get-go could have saved a lot of your advertising expenses!
A competitive market like the airline industry is not kind to mistakes. Collecting data is not enough. You need to get the sources right, and once that’s done, we recommend you focus your energies on quality.
But how do you measure quality, especially when the data you need to measure numbers in the millions?
We’ve been harping about the importance of data quality since day one. One of our earlier posts ‘perfecting the 1-10-100 rule in data quality’ emphasized the importance of quality data, and explained how the longer you take to rectify bad data, the worse its ramifications are.
Learn about the 1-10-100 rule in data quality here:

Create custom data quality metrics
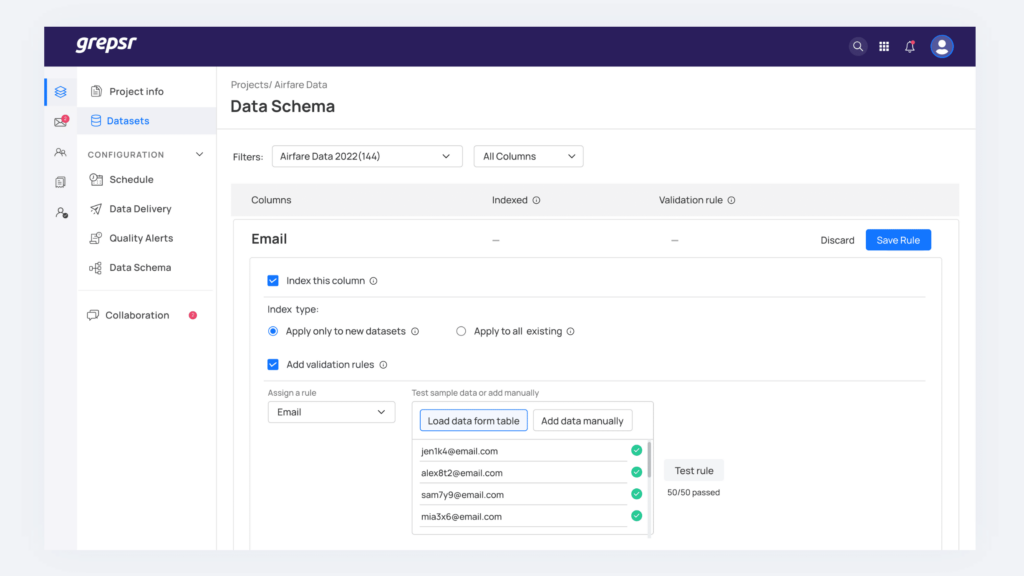
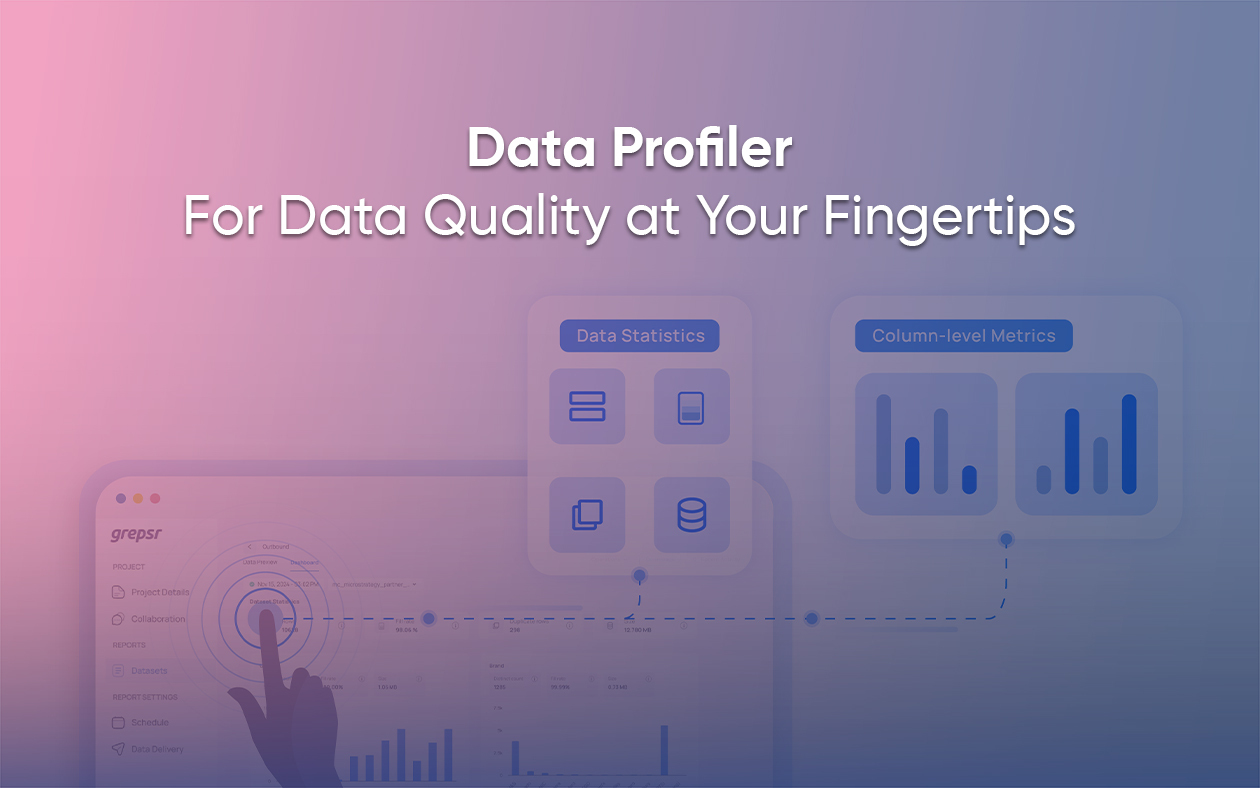
Grepsr’s data management platform empowers you to install your own validation criteria to your data project. Whatever the data field is, you can add validation criteria to all the columns in the data schema and measure data quality. This way, the stage is set for quality data extraction even before the data project takes flight.
Once you define the validation criteria, you can evaluate your data quality using the Grepsr data platform. Accuracy and fill rates are significant metrics in the data management platform to check the quality of your data.
Apart from accuracy and fill rate, the current and historical records, request count, row count, and their trends also help us analyze the integrity of your data.
More about data quality metrics
Accuracy
You can derive the accuracy of the entire dataset and even of particular columns using this function. To calculate accuracy, all you need to do is add relevant validation rules. When you process the dataset, each value in the dataset is compared to the validation rule. If the added rules align with the values completely, you get 100% accuracy.
For instance, if you set the validation rule for a particular column as ‘Email’ and the data extracted for the column contains valid email addresses on every cell, the accuracy of that particular column is 100%.
Fill rate
We use this metric to measure the completeness of your data. Similar to accuracy, you can derive the fill rate of the entire dataset or individual columns using this function. For example: if your dataset has 1000 rows, where ten values show null for a particular column, then we get a 99% fill rate.
Row count
The row count is an essential metric for data extraction. It gives information about the number of records extracted from the target site. The number of rows generated from a crawler is clearly visible from the dataset page of the platform.

Quality data metrics transparency
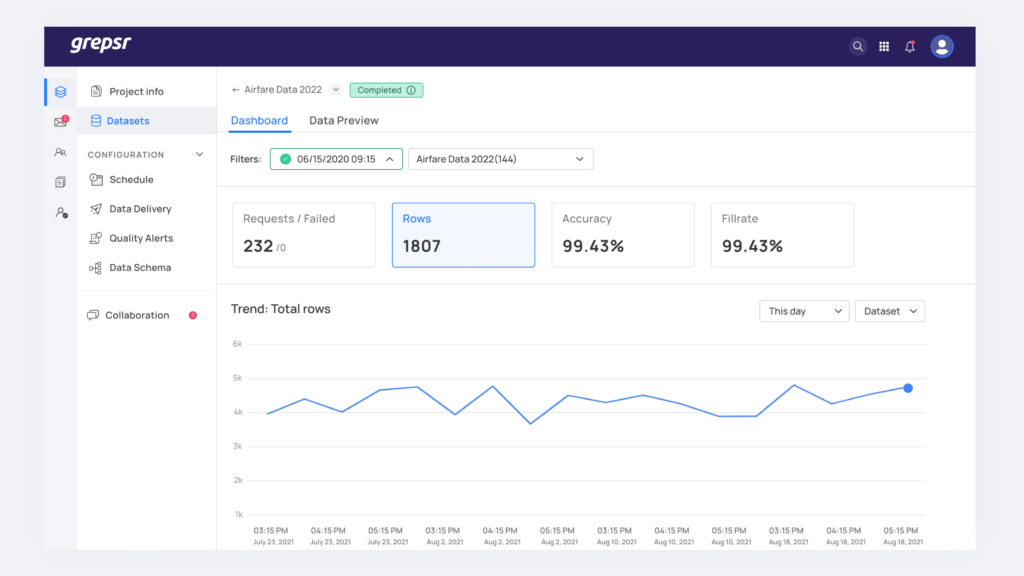
We’ve placed a special weightage on the transparency of your data quality metrics. The trend of all metrics for every crawler is transparent, and you can access it easily through the crawler dashboard.
If you are not inclined to monitor data in the traditional tabular format, you can simply refer to the visualization shared above. It helps you monitor and analyze data trends. As you can tell, unexpected fluctuations in the data are there for all to see.
Had one of the data points been somewhere near zero, it would have given us a clear indication of some erroneous behavior on part of the crawler or the source website.
With these metrics, you can:
- Proactively monitor and improve data quality
- Improve data extraction efficiency and effectiveness
- Take data-driven decisions
- Do away with the headaches associated with data extraction
- Focus on building your brand
- Gain a competitive edge in your industry
Performance alert based on data quality metrics
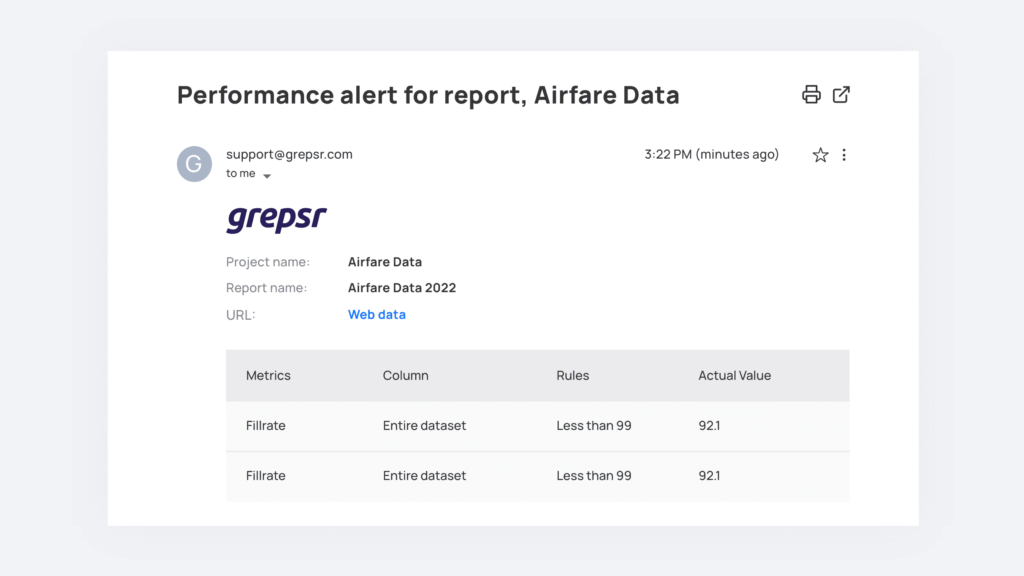
Internally, we have also implemented an alarm system so we are notified whenever the quality of your data is at stake, thereby keeping us up to date with all kinds of data anomalies. The stakeholder gets an alert immediately if the crawler comes across an oddity in the data. They then drill down further to identify the root cause.
When we fix the data issues, we record the operation and send a report over to you.
A keen eye for detail and the seamless collaboration between the Grepsr team and your team has helped us take data quality to the next level. We plan to have this rolled out to your team as well, so you can identify data issues before anybody else.
Data Quality Dashboard: Reloaded
The updated data quality dashboard is being developed at Grepsr as we write this article. Through the quality dashboard, we will be able to monitor all the crawlers constantly and identify any anomalies if and when they arise.
For instance, there will be a pool of crawlers with exceptions, and every time Grepsr users land on the dashboard, they can view such anomalies if they exist.
We’ve focused on visualizing those metrics vividly to ensure none of the issues escape the user’s eyes.
Besides that, the data quality dashboard will also display several metrics such as delivery, creation of schedules, and messaging, to name a few.
With this, Grepsr users can monitor events as they occur.
Final words
Whether you work in the airline industry or e-commerce, you need data at scale to make informed decisions.
Although web data is in plentiful supply these days, quality data, however, is anything but.
By actively setting and monitoring system-generated alerts through emails and the platform, we have been delivering quality for high-volume datasets.
Moreover, we have a dedicated QA team to run quality tests every day on the records processed to ensure that bad data never makes its way to you. Read about Grepsr’s QA protocols here:
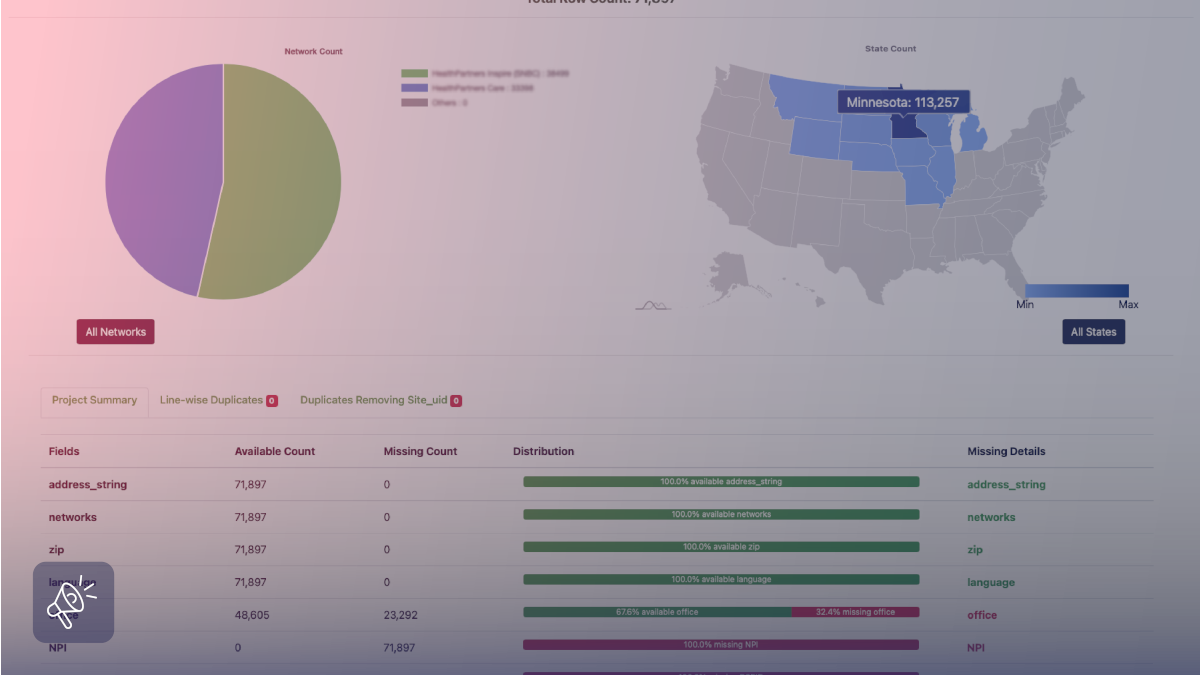
In this article, we touched just briefly on the steps we are taking to improve data quality. There is so much to share, and we will eventually.
All in all, by combining automation in the Grepsr data platform with manual checks, we have maintained data quality for high-volume projects.
If you have already delegated your data projects to Grepsr rest assured that the data you are feeding into your systems for analysis is of high quality. If you haven’t, well, you know what to do.
Related reads:


