Using poor-quality data is like navigating with a faulty compass—you’ll never reach your destination. But, you don’t have to stay lost, Grepsr Data Profiler ensures that you know your data quality metrics inside out.
High-quality, transparent data is the backbone of every data-driven organization. They are the foundation of competitive strategies, successful innovations, and informed business decision-making. Accurate and consistent data empower teams to align strategic goals in real-time and turn insights into actionable outcomes.
However, using poor data leads to flawed assumptions that result in missed opportunities and in the worst case, financial losses. Feeding inaccurate data into advanced analytical tools and machine learning models significantly reduces their potential to generate accurate results. Not only that, bad data also wastes time and resources due to manual corrections of dataset quality (duplicate check and fill rate), causing operational inefficiency.
Knowing that your data has inconsistencies might seem like a setback at first, but it’s actually a privilege— means you have a chance to fix it. For many enterprises, though, this realization comes too late. They only discover the flaws in their data after decisions backfire or strategies fail to deliver.

Grepsr Data Profiler to The Rescue
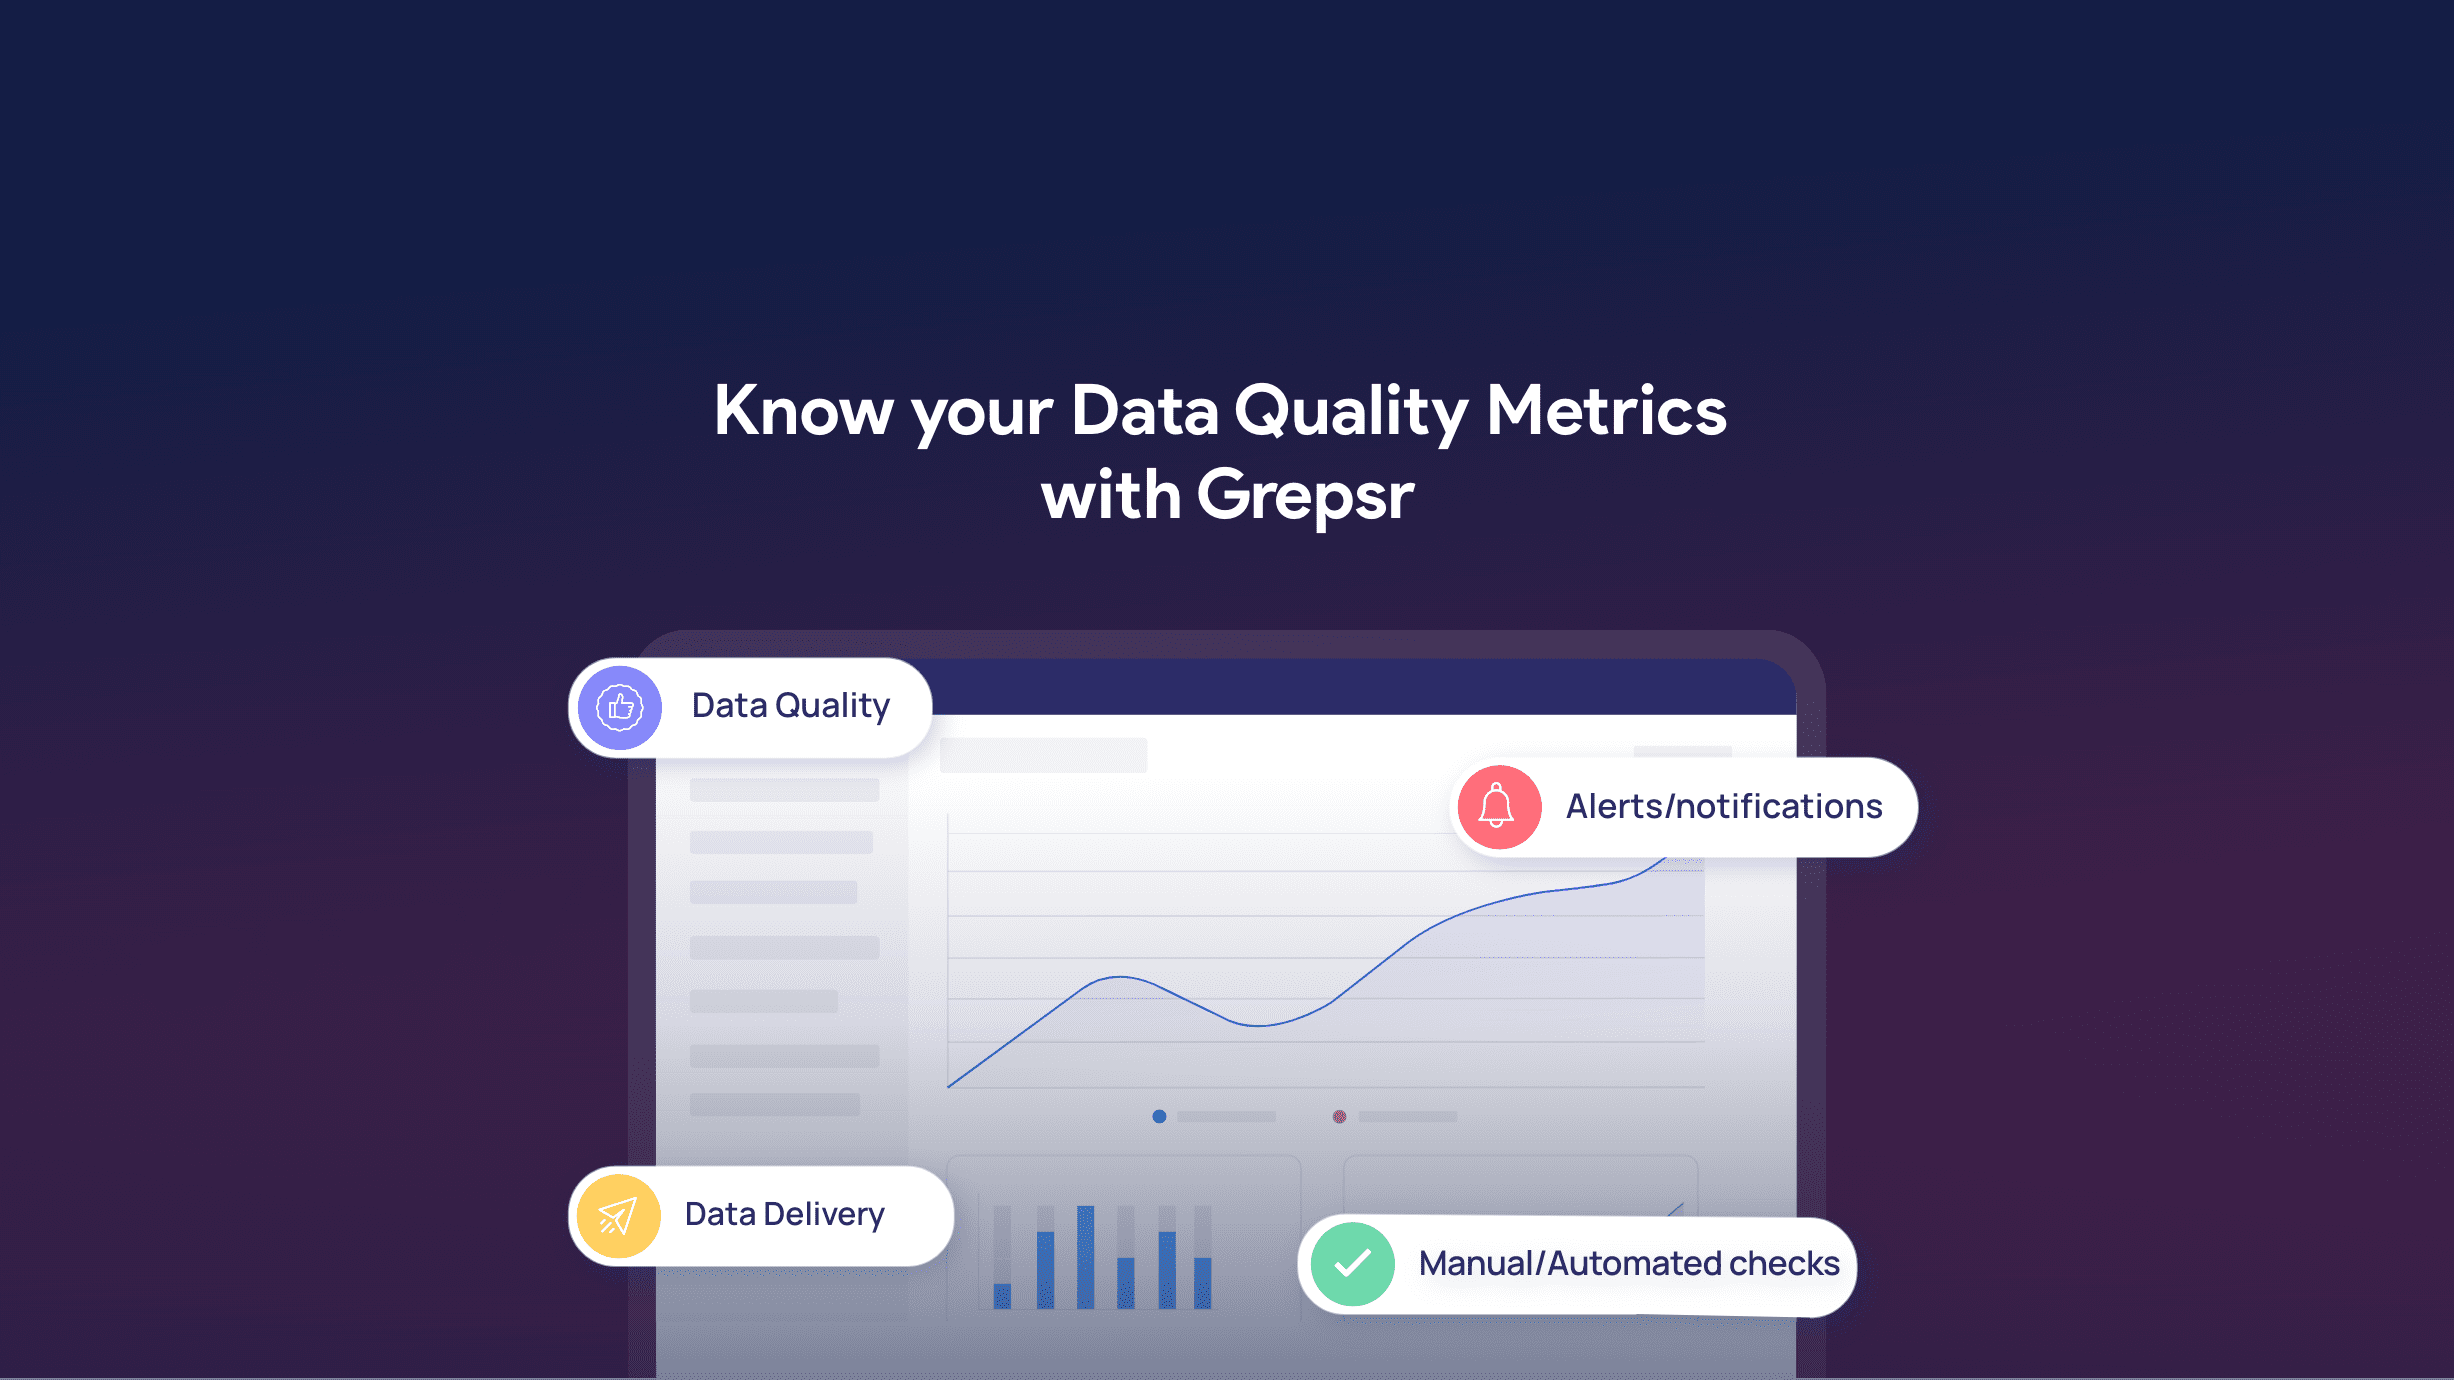
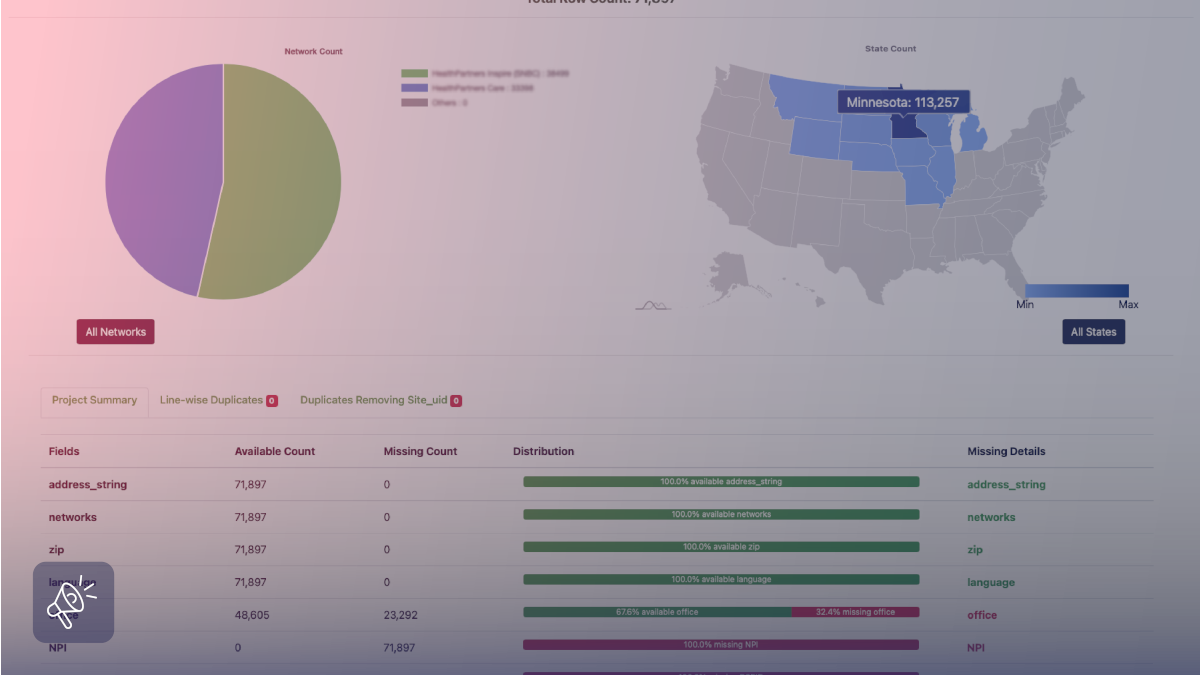
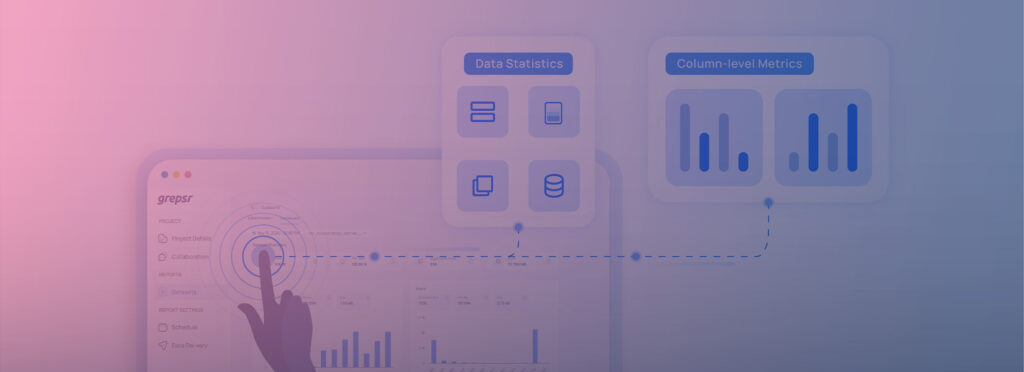
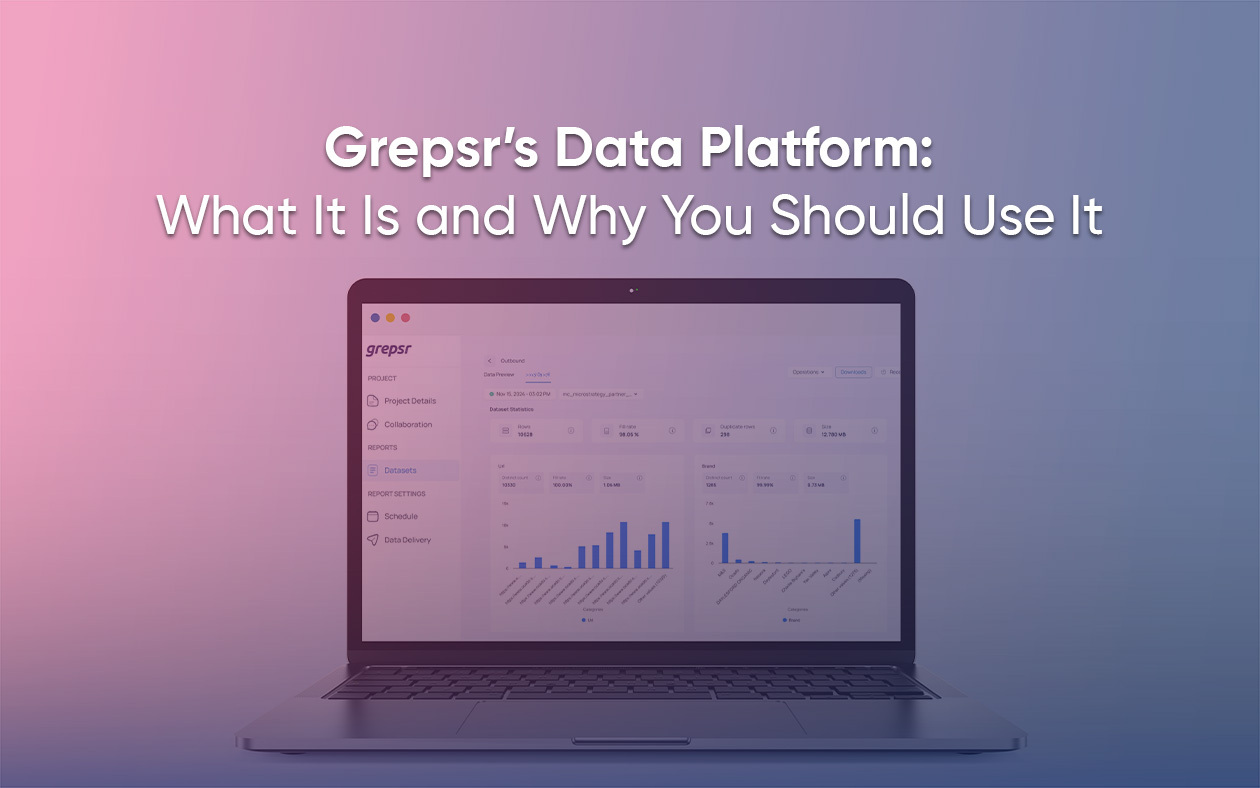
To prevent such scenarios, the Grepsr Data Platform offers advanced features like the Data Profiler as a proactive solution. The data profiler is a comprehensive data quality dashboard that provides actionable insights into your data’s quality and structure. Its core benefit is providing transparency in data quality which helps in identifying the issues early on before analysis.
Data Statistics
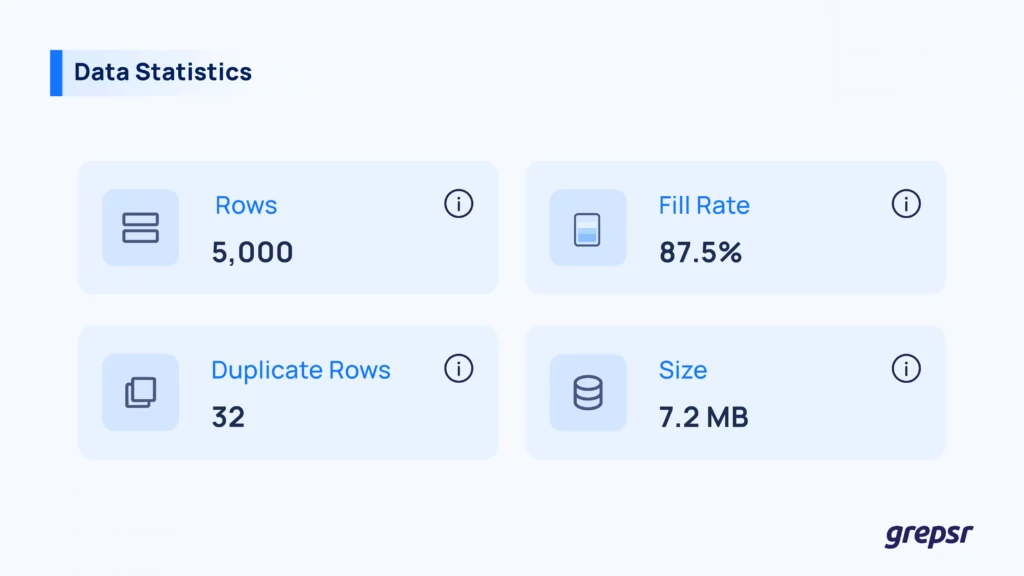
The Data Profiler offers a comprehensive overview of your dataset, helping you quickly understand its overall health. In data statistics, there are:
1. Rows and Size
The Data Profiler provides a total row count and dataset size, giving you a clear overview of your data’s scope. This feature simplifies scalability evaluation, helping you plan for growing data needs.
2. Fill Rate
It displays the percentage of complete data across the dataset, offering a glimpse of its overall quality. With this insight, you can quickly identify areas that need improvement.
3. Duplicate Rows
Highlights redundant rows in your dataset, to maintain data consistency and accuracy. Removing duplicates optimizes data quality and improves outputs after analysis.
These snapshots of data statistics ensure you’re always aware of your dataset’s completeness, consistency, structure, and overall quality.
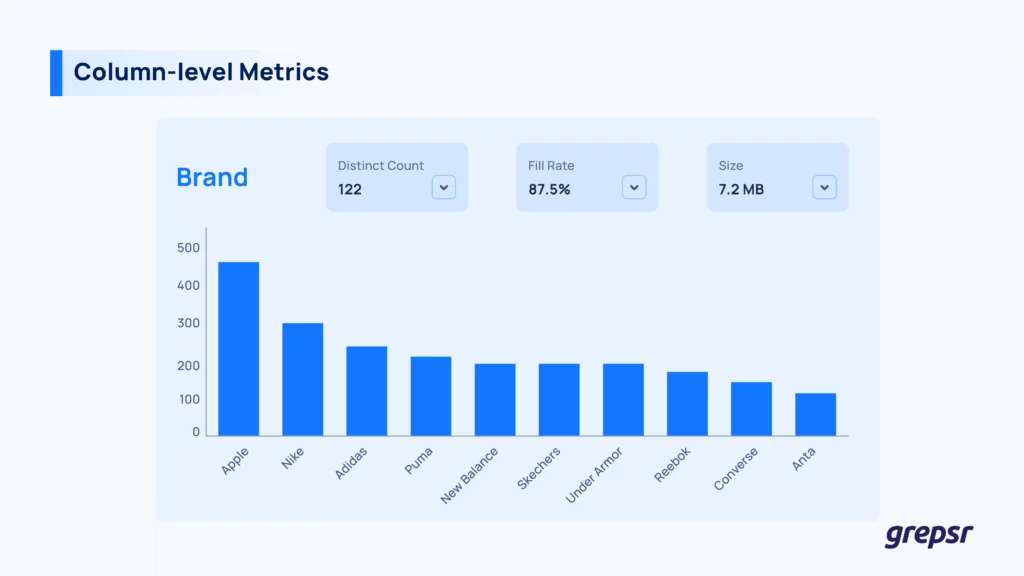
Column-level Metrics
You can also gain deeper insights into the specifics of your dataset with detailed column-level metrics such as:
1. Fill Rates for Each Column
Fill rates show the percentage of complete data measured at the individual column level. But, there is more to it. While the overall dataset fill rate provides a general sense of data completeness, it often lacks precision.
For example, suppose your goal is to monitor the price of a list of products. In that case, the price column becomes critical—any missing values here directly impact the analysis and decision-making process. However, other columns, such as product descriptions or images, may not carry the same weight and can tolerate some missing data without compromising the dataset’s usability.
Therefore, by analyzing fill rates at the column level, you can prioritize data-cleaning efforts, identify and resolve issues with the most crucial fields, and provide high data quality where it matters most.
2. Distinct Value Counts
It indicates the uniqueness of data in each column and helps identify potential anomalies in the dataset.
Let’s say that you want to monitor the inventory levels of your products on an e-commerce site. In this scenario, distinct values for each product’s SKUs (Stock Keeping Units) are vital for tracking and managing the inventory levels. If two different products share the same SKU or when there are duplicates or no values, it can lead to serious blunders in inventory management.
Thus, by analyzing distinct value counts for crucial data fields like SKUs, you can identify discrepancies and correct the issues such as duplicate or missing entries, before there are any overstocking or stockouts.
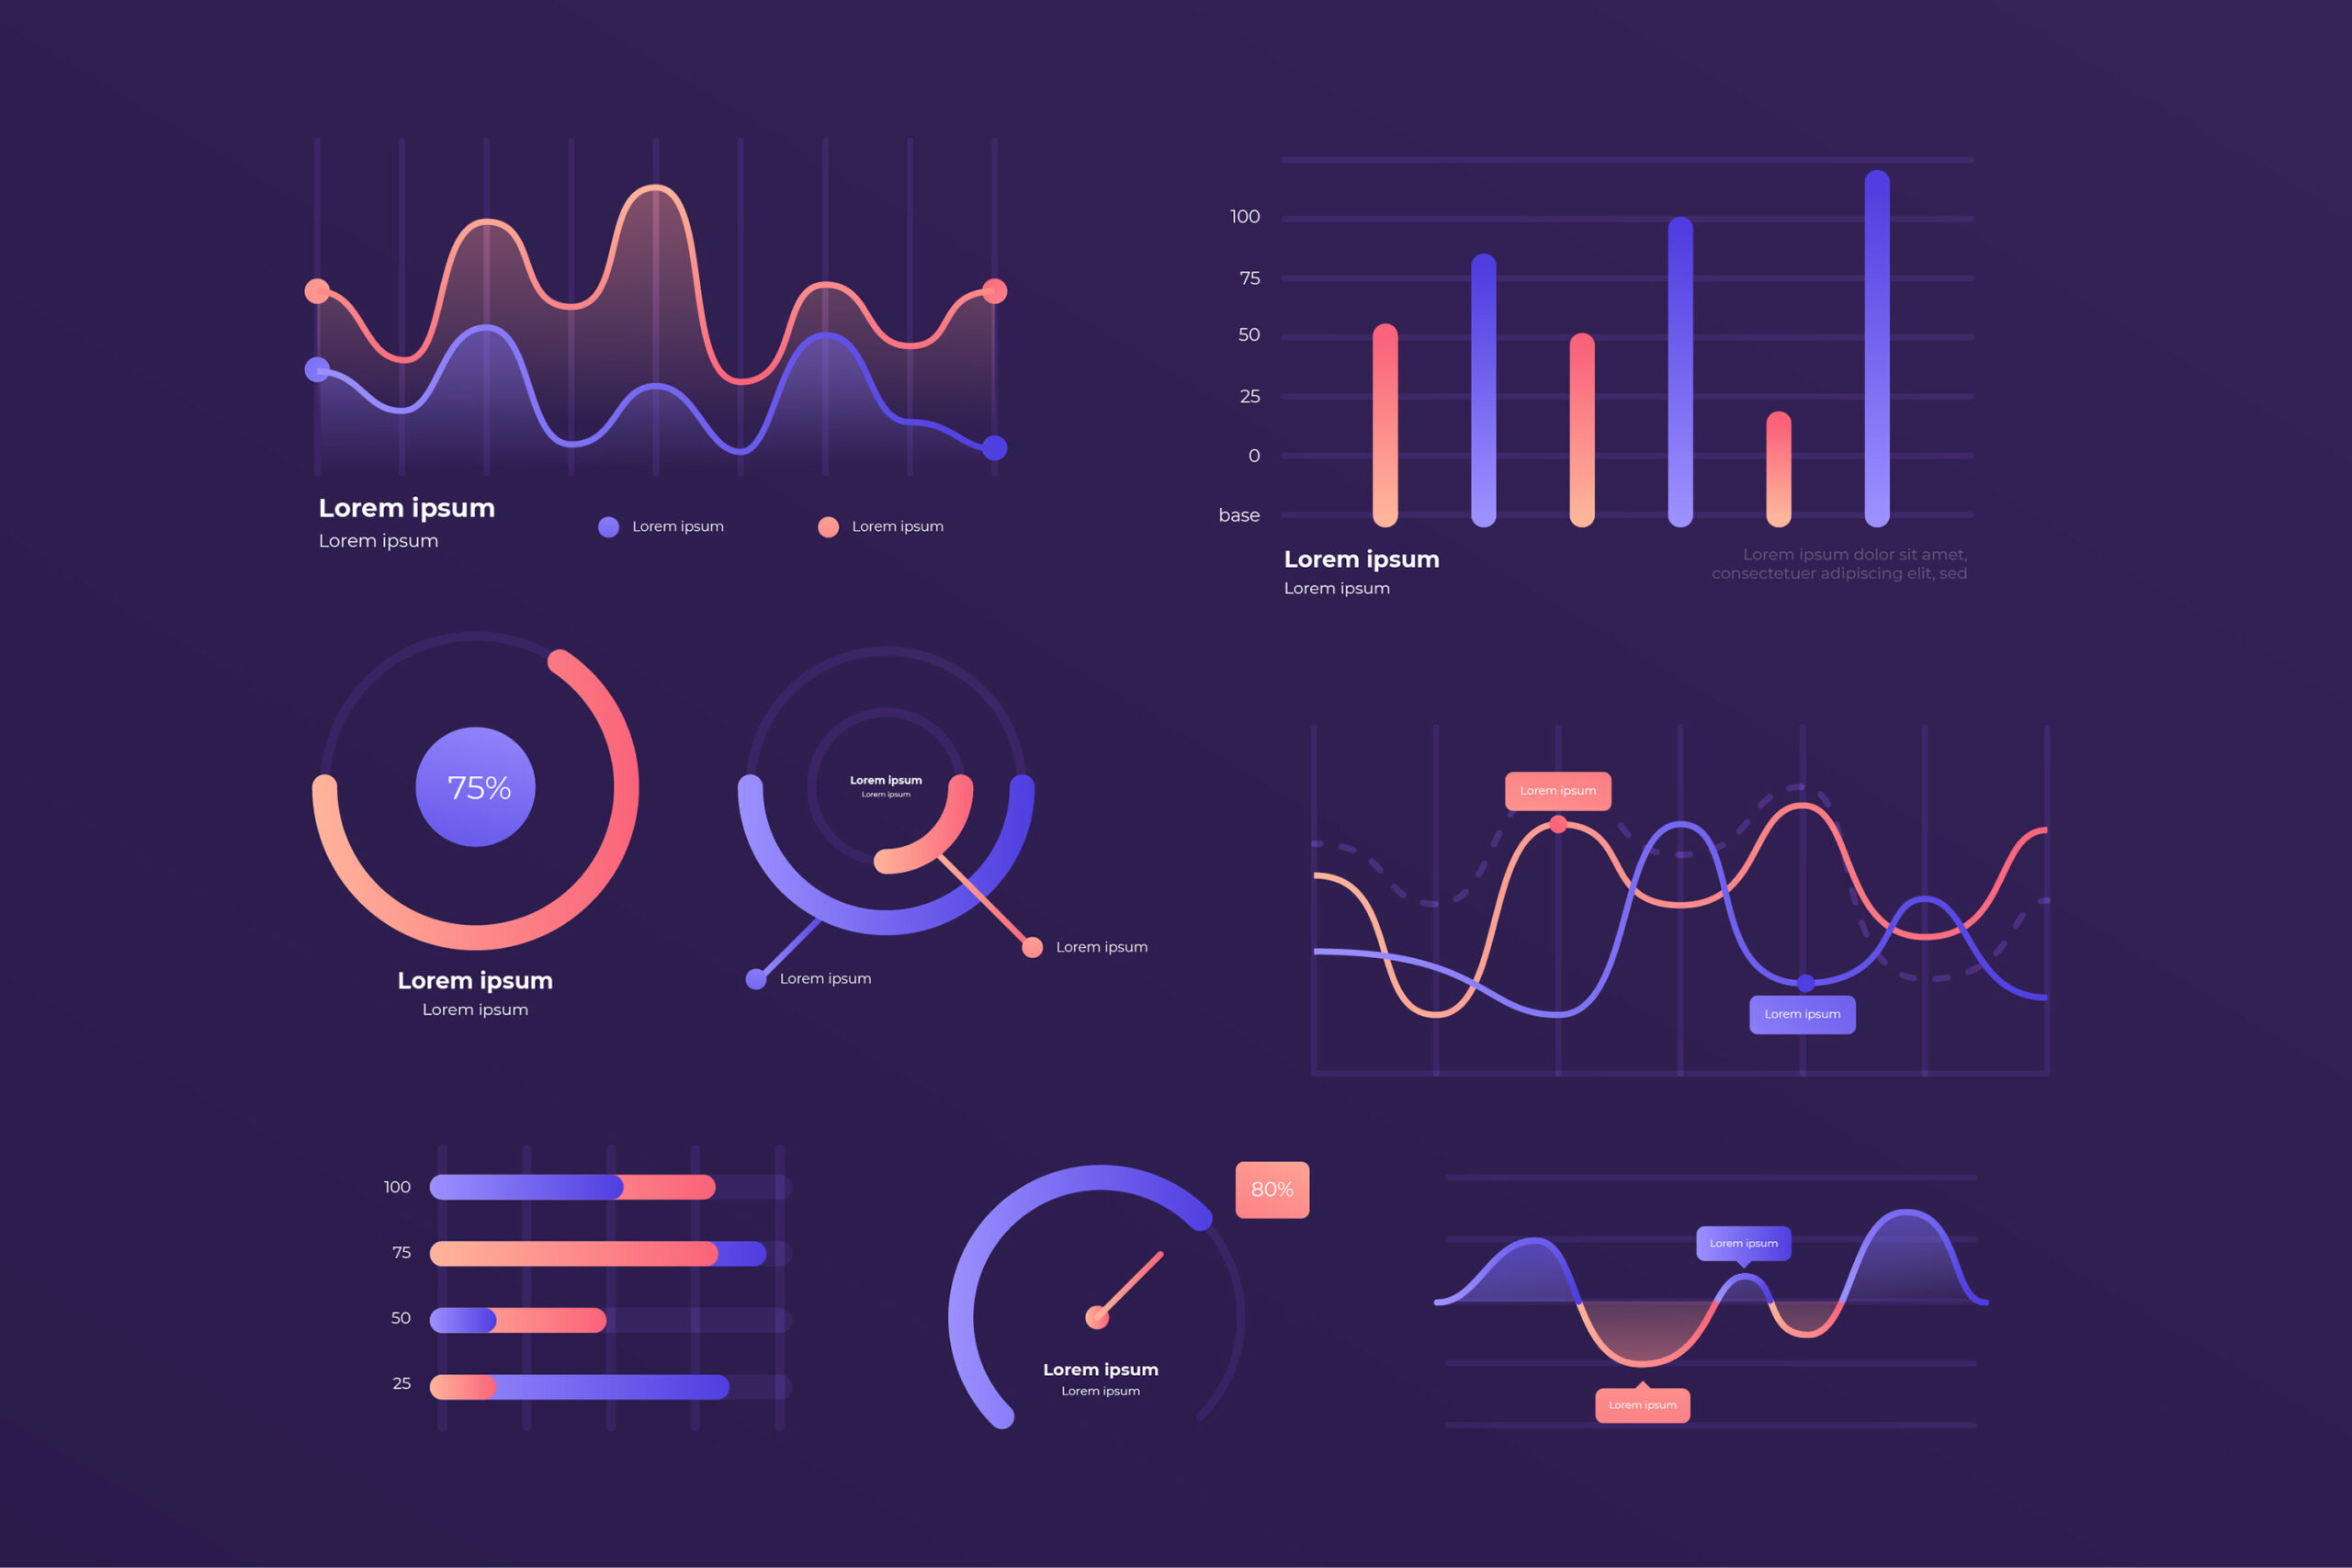
3. Visualized Distributions
The data profiler dashboard has charts and graphs that provide an intuitive view of your data, helping you recognize patterns, trends, or inconsistencies.
Imagine you are a wallet retailer analyzing the price column in a dataset of your competitor’s product listings. A column-level visualization with a histogram shows that most product prices cluster between the standard price of $20 and $50, but a few outliers exceed $60.
This sort of instant insight from the visualization of each column helps you investigate whether the outliers are valid representing premium products in the competitor’s catalog. Or if they indicate potential data extraction errors that need correction.
4. Column Size
The dashboard also reveals the storage space occupied by individual columns in the dataset. Analyzing column size is particularly useful for optimizing storage usage.
For instance, a column contains the dataset of product descriptions for 100 items in a list. Analyzing its size tells us that there are overly detailed unnecessary descriptions that occupy a disproportionate amount of storage. Then, you can take action to streamline the content by removing redundant information and extracting only the relevant details.
Hence, by monitoring the sizes of each column, you can optimize storage, enhance processing speed and maintain the scalability of datasets.
These granular-level insights into the quality of your datasets empower you to make informed decisions with confidence.
Related Article:
Why This Level of Transparency Is Crucial
Proactive Quality Monitoring – The Data Profiler grants you the ability to monitor data quality metrics in real-time, helping you address issues before they impact your operations.
Improved Decision-Making – Detailed insights into your data ensure teams can rely on accurate information to make informed and data-backed decisions.
Operational Efficiency – The easy assessment of data quality with the Data Profiler Dashboard saves time and reduces manual effort, letting you focus on strategic initiatives.
Trust and Compliance – Transparency in data quality helps meet industry standards, builds stakeholder trust, and ensures data-driven actions are grounded in reliability.
Thus, with the Data Profiler Dashboard in Grepsr Data Platform, you can stop relying on guesswork and work with data you can trust.
Get started with monitoring datasets using quality metrics and improve strategic decision-making by leveraging Data Profiler insights in real-time!