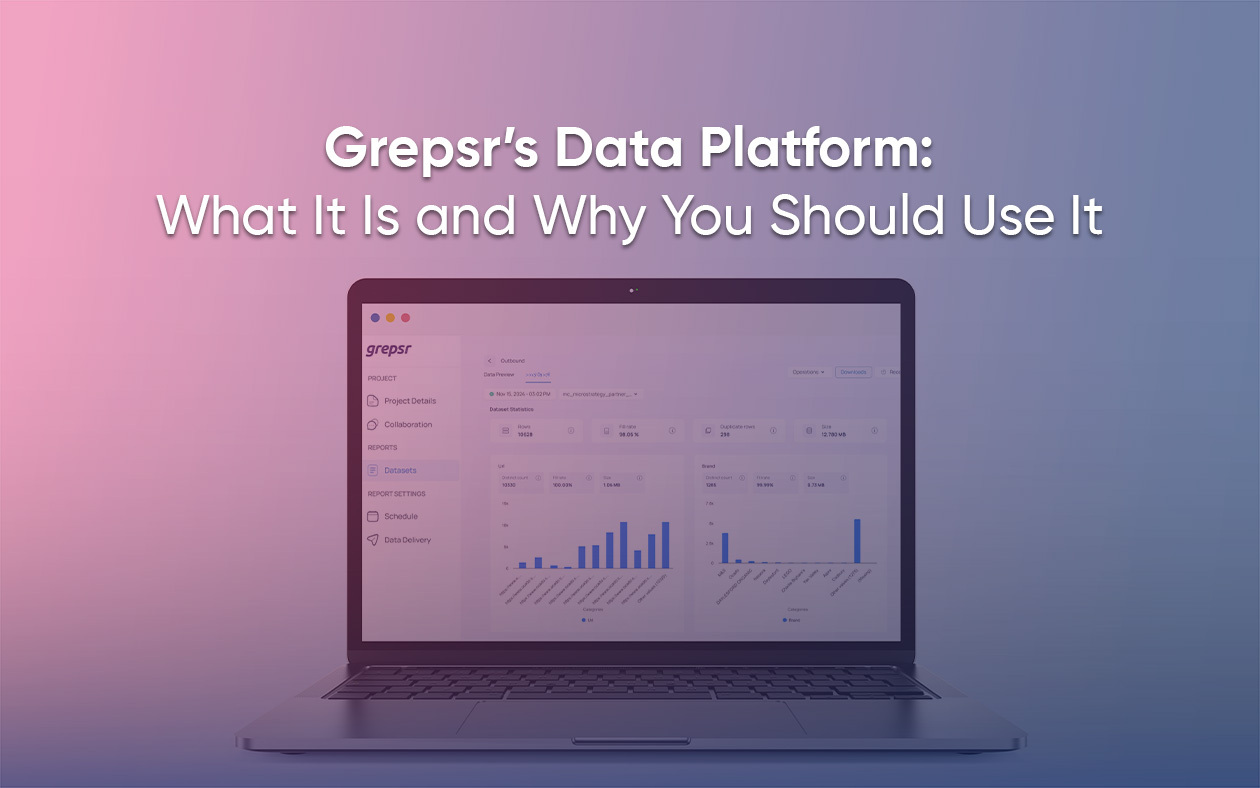
In a market that changes every week, collecting web data is only the first mile. The real advantage comes from what happens next, when raw information turns into decisions that your teams can trust.
Business Analysts, Data Scientists, and Product Managers already know the pain of messy spreadsheets, late dashboards, and ad-hoc fixes that never seem to end.
This blog explains how automated data analysis, following scraping, removes that friction, shortens the path to answers, and makes your decisions more consistent.
The need for automation in data analysis
Data is everywhere, but valuable insight is still scarce. When analysis relies on manual work, teams spend hours cleaning fields, reconciling duplicates, and chasing errors that appear the night before a review.
Automation changes the rhythm. When you codify the steps after scraping and let reliable jobs run them daily, you achieve two outcomes simultaneously: speed and trust. Insights arrive when you need them, and the numbers behind those insights are repeatable and reliable.
Building an automated analytics pipeline
A strong analytics pipeline is not complicated. It is simply a small set of steps that run continuously, regardless of how busy the week becomes.
- Data collection and web scraping
Everything starts with a dependable collection. If your sources break every time a layout changes, the rest of the pipeline will never feel stable. Capture the fields that decision makers actually use, and always keep the timestamp, URL, and source so you can trace any number back to its origin.
Grepsr focuses on resilient collection with change handling and service-level controls, so upstream signals remain steady while your teams work on analysis. Learn more on our web data extraction services page.
- Data cleaning and transformation
This is where raw materials are transformed into usable products. Enforce an explicit schema, standardize currencies and units, remove duplicates, and address common issues such as missing values or invalid types. Treat these rules as code, not as a one-off spreadsheet. When cleaning is automated, your team stops arguing about versions and starts discussing what the data means.
- Data integration
Real insight often sits at the intersection of sources. Bring marketplaces, reviews, product pages, and inventory feeds together, then match the same entity across sites with a repeatable method. Use reference lists for brands and categories to avoid reinventing logic in every report. A unified view makes the following conversation faster because everyone sees the same picture.
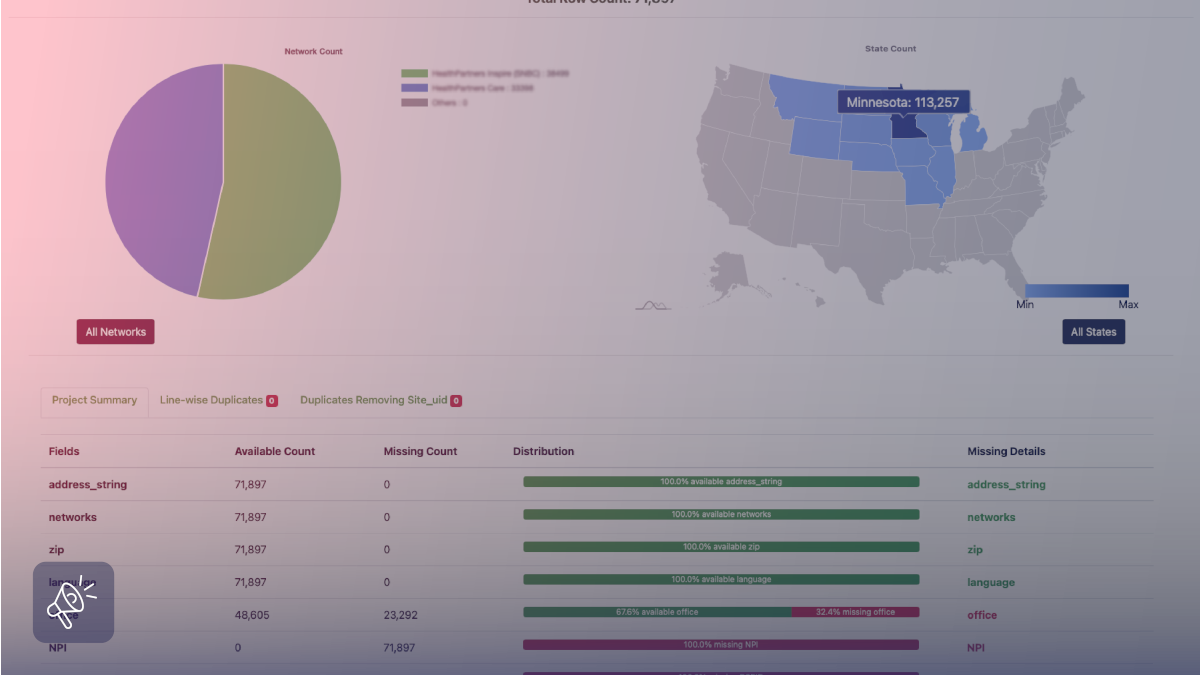
- Validation and quality that you can measure
Quality becomes real when it is measured. Define what “good” means before you publish a single chart. Freshness within a day for price intelligence, very high completeness on required fields, a strict target for duplicate rates, and anomaly checks for sudden swings are simple rules that protect trust. When a rule is breached, the system should tell you first, not your stakeholders.
- Automated reporting and BI automation
Good analysis is not a collection of charts. It is a steady flow of answers to the same questions every day. Automated reporting delivers those answers on a schedule, while BI automation keeps dashboards up to date without manual refreshes. The best views are specific: a list of SKUs that should change price today, products with unusual review trends this week, stores at risk of stockouts tomorrow. When a view suggests a next step, people use it.
How BI tools fit into the flow
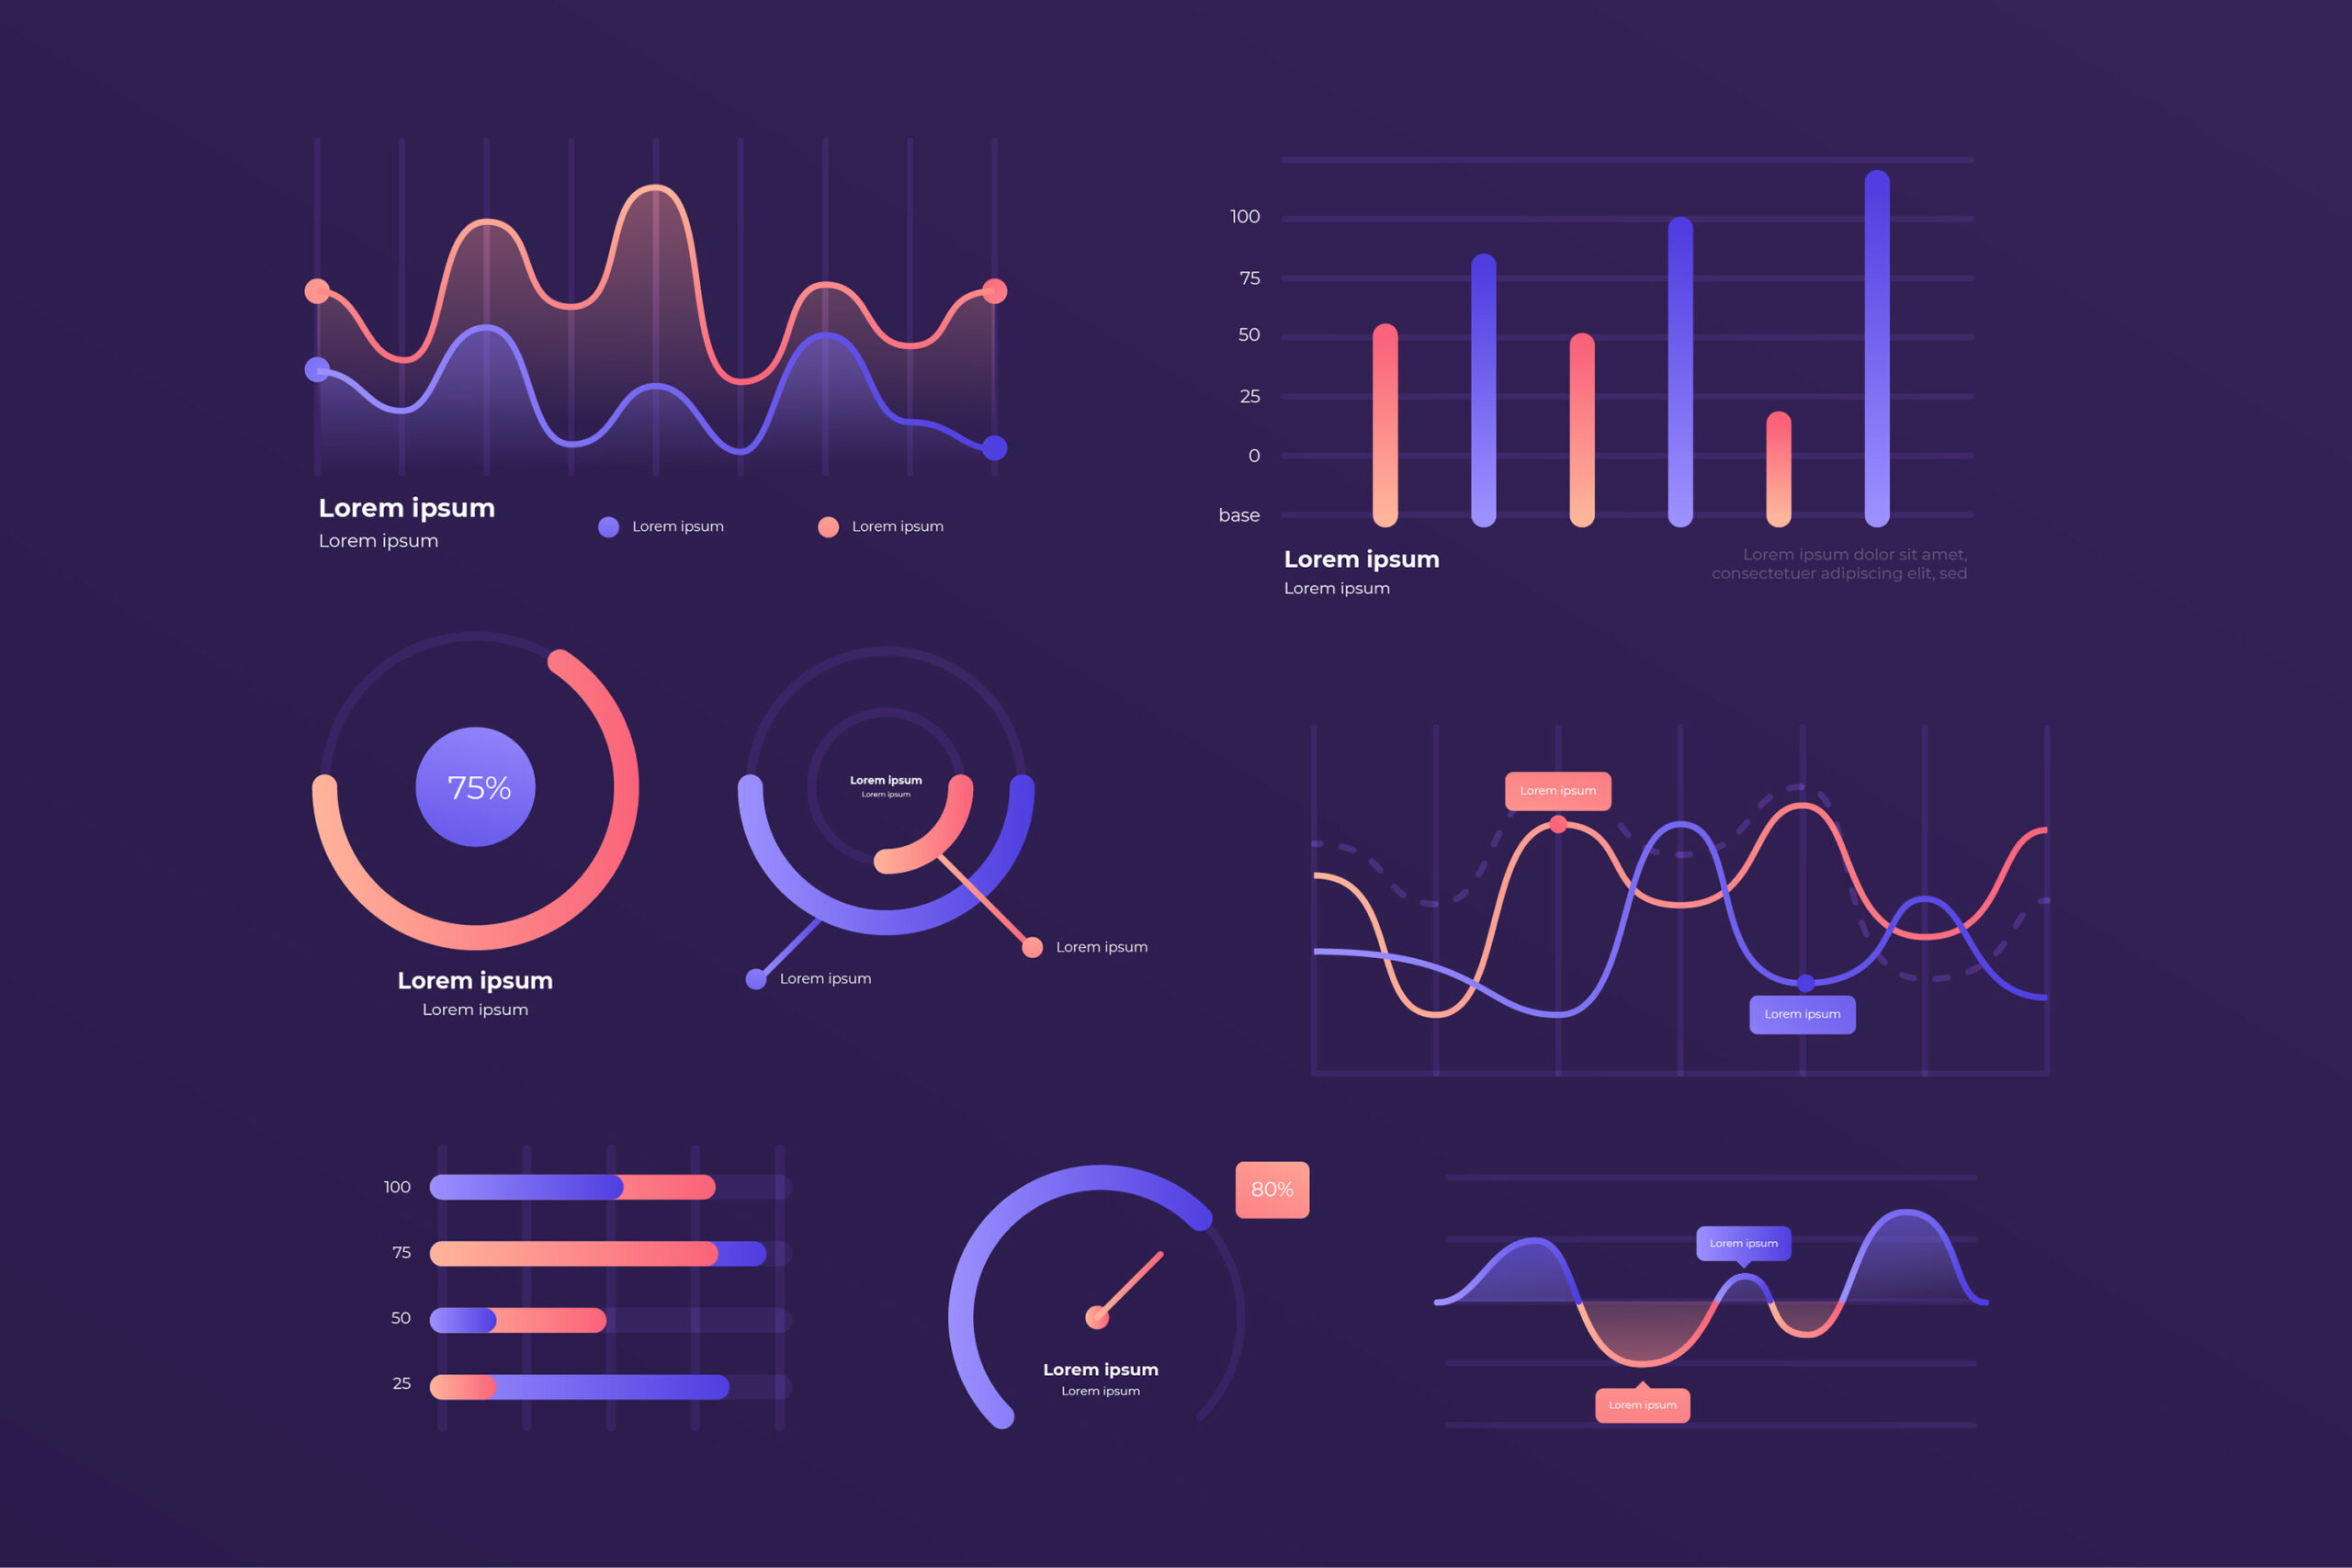
Modern BI makes it easier to see and share what matters. Predictive features help you forecast promotions and demand. Clean visualizations turn large tables into simple stories that busy teams can act on.
Real-time monitoring enables continuous assessment of the pipeline’s health, ensuring no surprises during reviews. The tools are essential, but the discipline behind them matters more. If the data is clean and the pipeline is steady, the tools will shine.
From insight to action for product managers
Product managers move fast when they have the proper signal at the right time. With automated data analysis, they can track competitor changes as they occur, identify emerging themes in reviews, and observe which features drive adoption across markets. This makes roadmap choices easier. It also reduces the guesswork in launches and promotions by consistently and reliably answering the same questions.
Preparing data for LLM use
Many teams now want to gather high-quality web data for LLM applications. The preparation is similar to BI, with a few extra rules. Keep provenance, including the source URL and timestamp, so retrieval has context. Normalize formats so the model sees consistent fields across sources. Remove near-duplicate content and boilerplate. Add clean metadata for sections and topics. These steps enhance grounding, minimize noise, and make assistants more effective.
Proving value and measuring ROI
You do not need a giant program to show impact. Pick one question that the business already cares about, answer it with a few strong sources, and automate the steps. Track the gains in three areas that matter to leaders.
First, cost savings from fewer manual hours and fewer fixes. Second, speed to insight, measured by how quickly a market change appears on a dashboard and how fast teams act—third, quality and trust, shown by freshness, completeness, duplicate rate, and clear lineage.
If you want a single line to report, use a simple equation: ROI % equals the difference between benefits and costs, divided by costs, multiplied by one hundred. Report it monthly, and tie each number to a real decision.
A simple way to get started
- Choose one use case that already has an owner and a KPI.
- Select two or three sources that answer that use case well.
- Write a short data contract for fields, freshness, and quality targets.
- Build a decision view that the team will review daily, and then schedule the pipeline accordingly.
This rhythm earns trust quickly. Once the first loop works, add sources, widen the view, and repeat the same steps.
What comes next
Automation is getting smarter. As AI and machine learning continue to improve, pattern detection and forecasting become more accurate and easier to deploy. The foundation still matters. Clean inputs, clear rules, and stable delivery will always beat clever models on messy data.
How does Grepsr help?
Grepsr focuses on the parts that make everything else work. Stable, scalable collection across changing sites. Clean data with validation, enrichment, and consistent schemas. Delivery straight into your warehouse or lake, ready for your models and your BI. The result is a dependable pipeline that supports automated data analysis, automated reporting, and BI automation without extra effort from your team.
Frequently Asked Questions
1. What is automated data analysis, in plain words?
It is the practice of turning repeated manual steps after scraping into reliable jobs that run on their own, so teams get answers faster and with fewer errors.
2. Why is data cleaning so crucial in the pipeline?
Cleaning ensures that the rules governing the comparison of numbers remain consistent over time. When types, units, and categories are consistent, trends are real and decisions are safer.
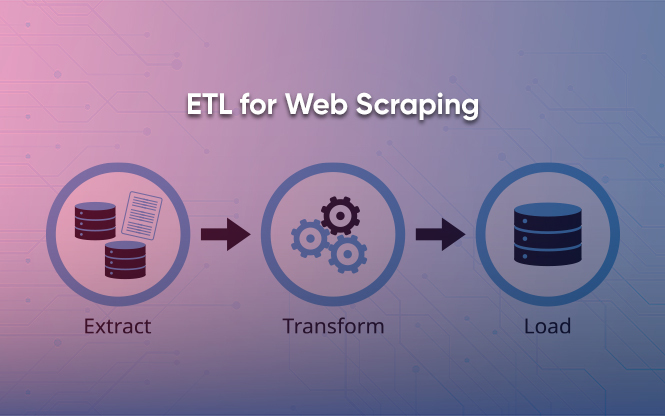
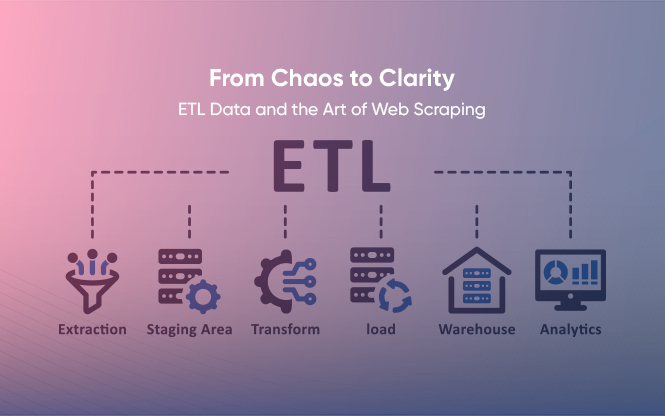
3. Where does ETL fit in this picture?
ETL sits between collection and reporting. It extracts raw data, transforms it into a standard format, and loads it into storage, providing a solid foundation for BI and models.
4. How do automated reporting and BI automation help day-to-day?
They keep decision views up to date without manual refreshes and deliver summaries on schedule. Teams see what changed and what to do next, without having to hunt for it.
5. Can we use this data for LLMs as well as BI?
Yes. If you keep provenance, normalize formats, and add clean metadata, the same pipeline can feed retrieval workflows and assistants with less rework.
6. How fast can a team show impact?
Most teams can show value in two weeks by focusing on one question, a few sources, and one decision view that is used every day.